Crunch the Numbers: How to Get the Most Out of Your Supply Chain Data
Today, supply chains generate and track more data than ever before.
Every load you ship produces quantitative information — how much you paid, how long it was in transit, dwell time, accessorials and so on.
Over time, these data points add up to provide a comprehensive, detailed look at the health of your supply chain.
But how do you avoid drowning in all this data? How do you take this incredible wealth of information, distill it down into clear and actionable insights, and use it to create a competitive advantage for your logistics team?
Learn about the kinds of supply chain data out there, how to get the most out of them, and when to bring in supply chain engineers or consultants to help you truly become a data-savvy shipper.
Your Supply Chain Data Road Map
What Types of Supply Chain Data Can You Collect?
Because your supply chain is generating a vast wealth of information every single day, it’s helpful to break it down into groups by type. Doing so can help you better understand which data is most valuable to your current business goals and needs and which are just noise.
While our general advice is to collect and track all of the data mentioned here, the ones you really want to dig into will depend on your specific business goals and needs. Consider the logistics key performance indicators (KPIs) that matter most to you when strategizing which metrics to prioritize.
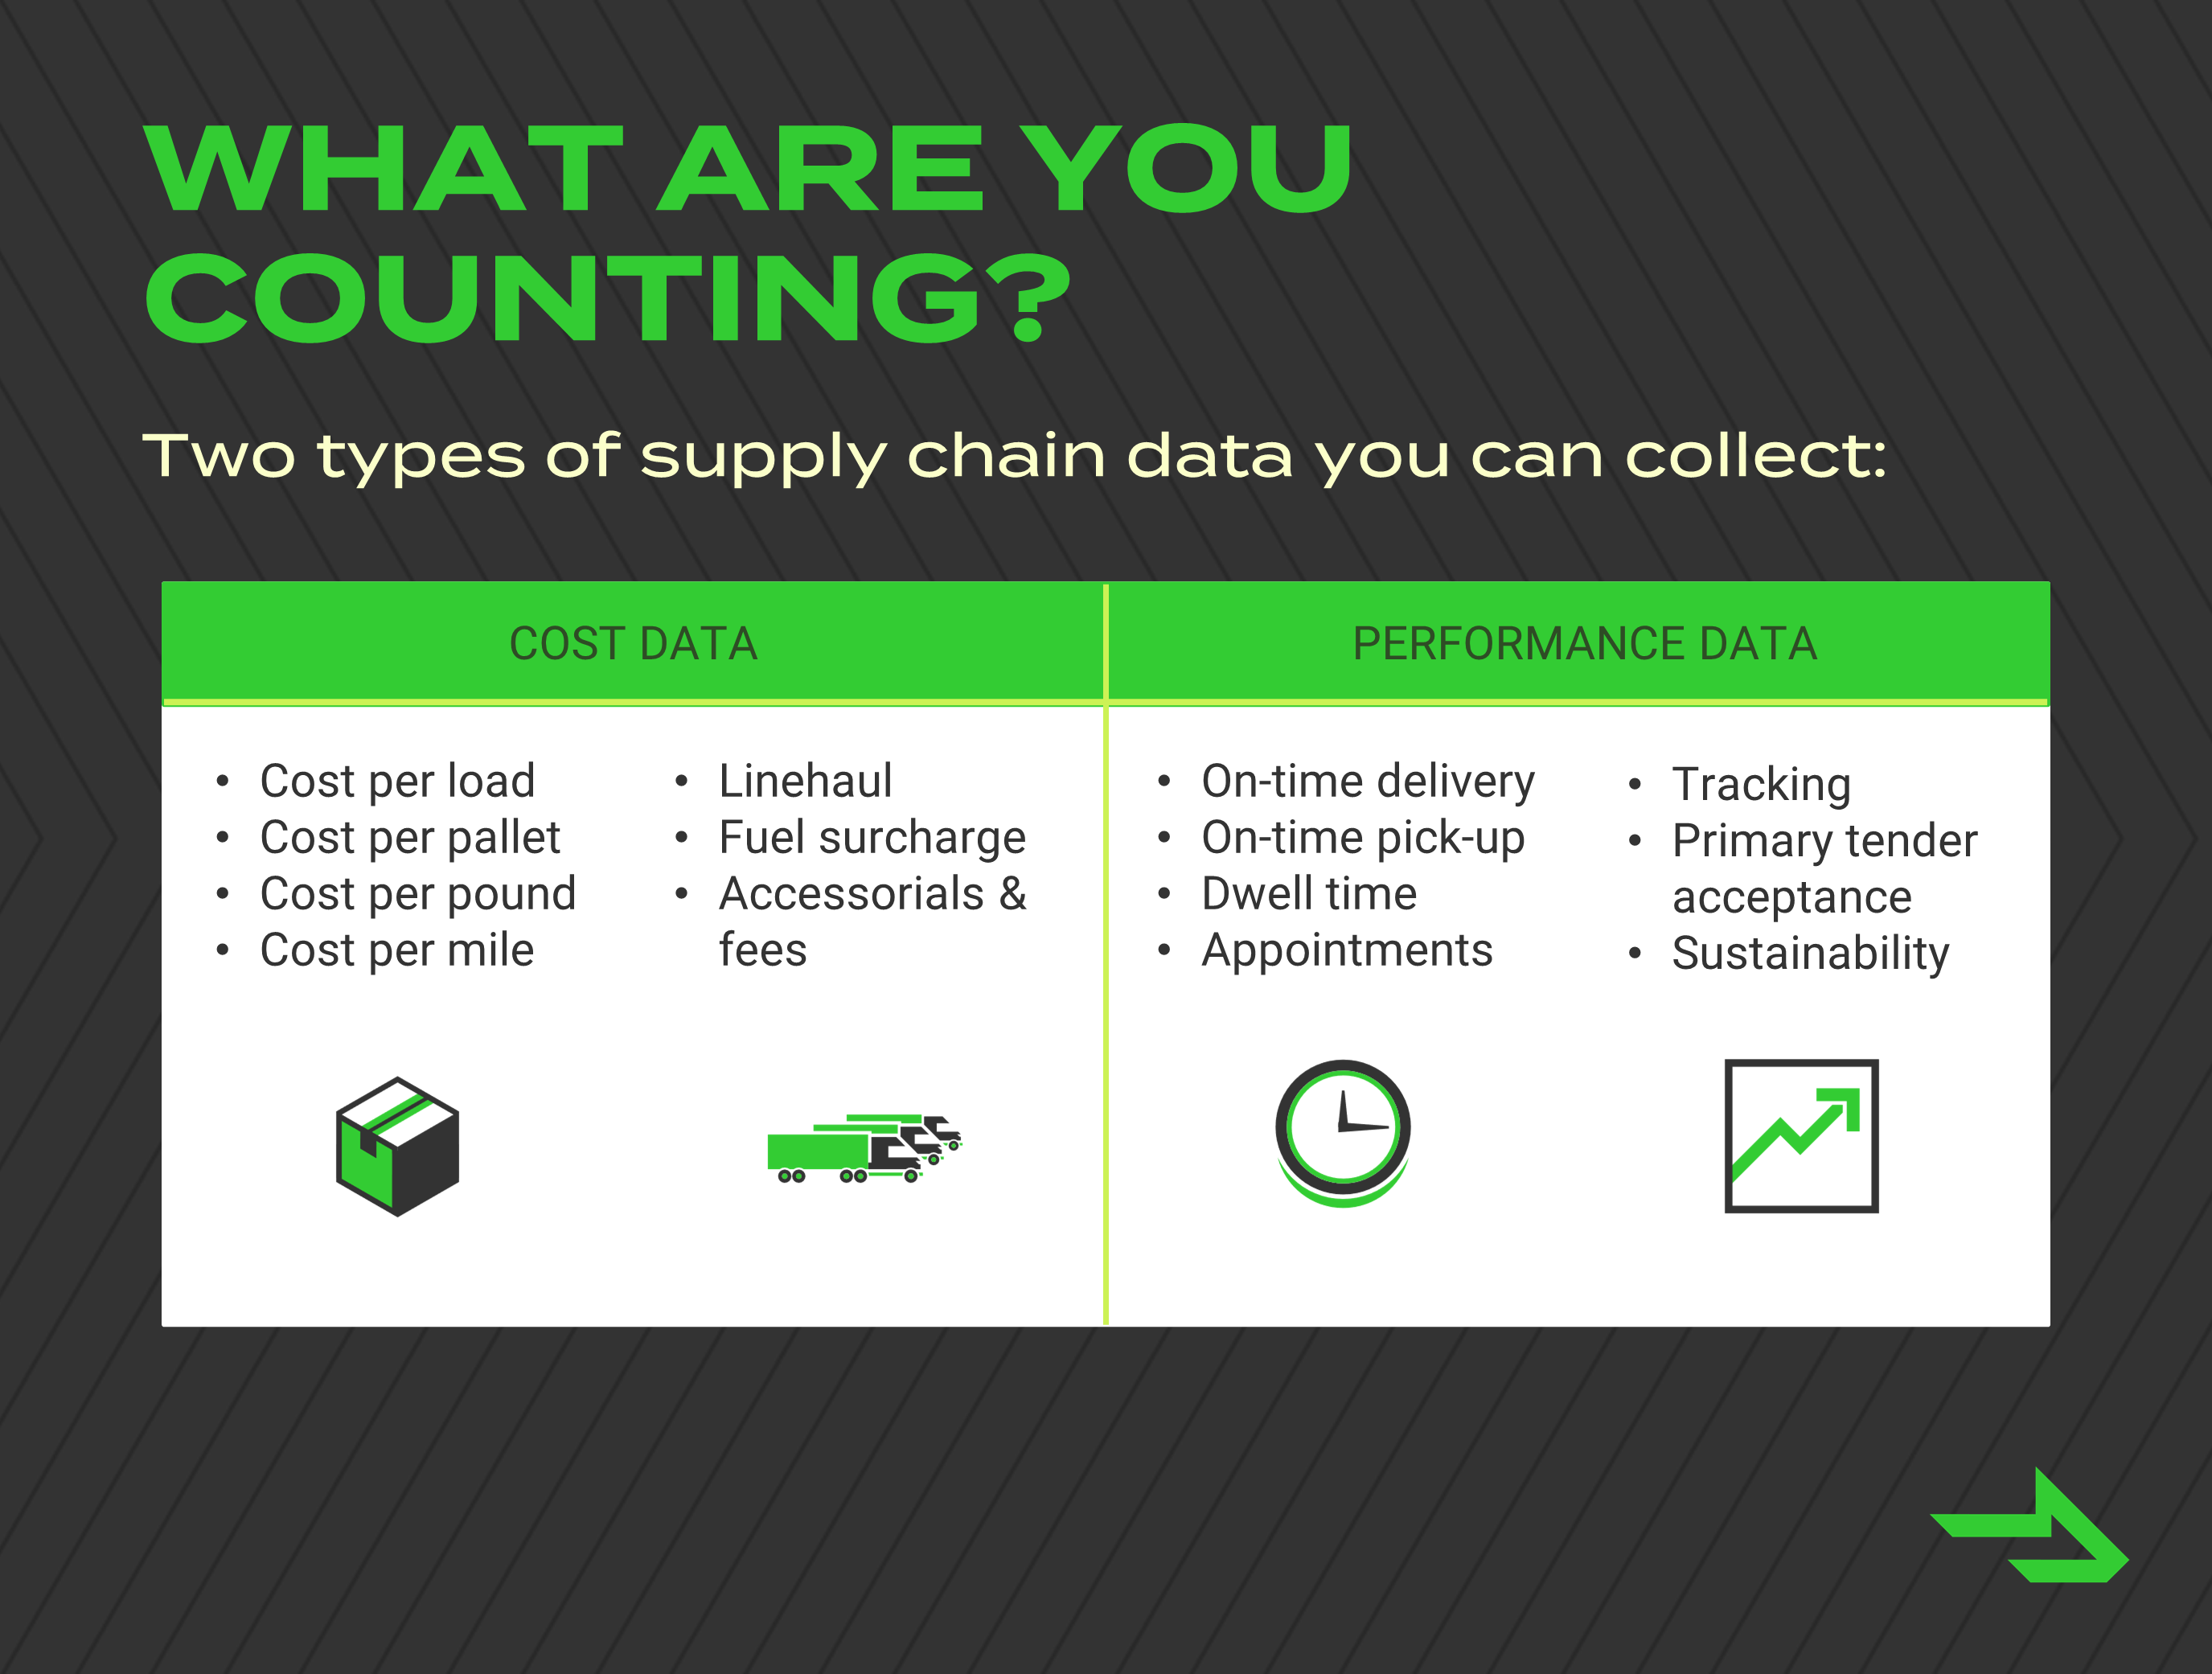
In general, you can break supply chain data down into two broad categories.
Cost Data
Everything that goes into your supply chain generates a line item for your logistics budget, and there are multiple ways to break down your total spend into chunks that offer insights.
Tracking cost per load is great for a quick look at your overall supply chain costs and can be a valuable metric for year-over-year comparisons. It can help you see if you’re on track to stay within budget for the year and help you project your budget for upcoming years.
You can further break down it down into cost per pallet or cost per pound to see what you’re spending to move different types of freight.
To more easily see how you’re performing relative to your shipping peers, you can turn to cost per mile. This will normalize your spend across lanes of varying lengths and create a point of comparison to fluctuating freight market rates.
Want to get more granular? You can break the cost of each shipment down into its component parts:
- Linehaul
- Fuel surcharge
- Accessorials & fees
This data is very valuable if you are experiencing cost overruns and looking for the culprit. You can identify whether you’re exceeding your budget due to factors you can’t really control (elevated fuel costs, for instance) or ones that are in your power to correct (consistent detention fees at an underperforming facility, trailer underutilization).
Setting targets for each of these cost metrics and reading them together holistically can also tell an important story. Let’s say cost per mile is aligned with the current market and within your targets but you’re still running over in cost per load. This might mean it’s time for a network optimization project that examines facility location and routing throughout your supply chain to root out inefficiencies.
Performance Data
While cost KPIs are vital to every supply chain, they don’t tell the whole story. You need to be able to see how your transportation network is performing to keep operations running smoothly at your facilities, your customers happy and your product stocked on shelves.
Many shippers prioritize on-time delivery and on-time pick-up rates when examining their network performance. In our original research study on logistics KPI benchmarks, 85% of shippers rated on-time delivery as somewhat or very important, and 80% said the same of on-time pick-up.
Other metrics shippers commonly use to track carriers’ performance are rates of primary tender acceptance, appointment scheduling compliance and tracking compliance. These numbers can help you see which providers are prioritizing your freight and which don’t value your satisfaction as highly.
To evaluate your own performance, you can look at dwell time at each of your facilities, or the amount of time carriers are regularly waiting to load or unload your freight. This information will help you assess where you should improve efficiency to keep your product moving, your costs down and your relationships with carriers strong.
Finally, many shippers are taking an increased interest in sustainability metrics such as their overall carbon footprint. If you’re tracking emissions and missing your targets, you can consider adding intermodal to your shipping mix to see immediate improvements.
How Can Data Reports Help You See Trends & Set Strategy?
Data on its own can be extremely difficult to digest. Even smaller supply chains generate hundreds or thousands of data points a year, and you need effective tools to help you understand the story these numbers are telling you.
Such tools typically take the form of analytics reports that help you group data into meaningful sets and visualize comparisons or changes over time.
Popular Supply Chain Data Reports
Load Detail Reports
These reports can range in size from broad overarching documents that contain every detail for every shipment you’ve moved over a period of time to narrower ones that focus on financial information or other metrics.
They often take the form of Excel spreadsheets that can be filtered to display targeted groupings of information — all shipments in a specific lane, for instance, or for a specific facility, or with cost per mile exceeding a certain rate.
Load detail reports are powerful tools that can help you quickly identify meaningful trends in your supply chain data. When used correctly, they will let you zero in on the specific areas where optimizations can have a real impact.
Carrier Scorecards
It’s important to evaluate the performance of the providers in your transportation network regularly, and carrier scorecards are the main tools you’ll use to do so.
Carrier scorecards typically focus on the performance of a single provider, detailing how often they hit their targets for KPIs like on-time delivery and pick-up, primary tender acceptance, or bounce rate (how often they accept a shipment but cannot complete it due to mechanical failure or another unexpected issue).
Most shippers use carrier scorecards during regular reviews with their providers to highlight what’s working well and identify areas for improvement.
You can also create network-wide scorecards for a quick glance at the overall health of transportation across your supply chain.
Tracking Reports
If you’re managing your shipments with a transportation management system (TMS — more on that below), you should be able to pull a real-time report on all your freight currently in transit.
These tracking reports will show you where your freight is, whether any incidents have been logged by your carriers and whether any shipments are at risk of missing their delivery targets.
Want Analytics Reports Like These for Your Supply Chain?
Our free, cloud-based TMS CoyoteGO® Premium lets you tender freight to any carrier, manage shipments and track performance with seven unique data reports. Read more about this powerful platform and schedule a demo to see it in action.
How Do You Use Supply Chain Data?
You know what data you can collect and some tools you can use to track it — now comes the fun part. It’s time to build a supply chain data strategy.
Follow these four tips when managing your data to keep it accurate and actionable.
1. Collect consistently and comprehensively.
Incomplete data is the most common barrier to being able to create an actionable strategy from it. For the trends and models you’re extrapolating from your data to be accurate, you need be sure your inputs are telling the whole story.
Even if you’re not sure how you’re going to use a specific type of information, if your transactions or operations are generating it, it’s in your best interest to collect it.
2. Choose the right software to help you out.
Small businesses with simple supply chains and limited transportation budgets may be OK tracking shipments manually in Excel, but most shippers will benefit greatly by using a TMS.
There are many options out there when you’re choosing a TMS, and you’re sure to be able to find one at the right price point and level of sophistication for a business of your size. There are even powerful free TMS platforms out there — look no further than our very own CoyoteGO Premium.
3. Pull reports regularly to track trends.
Data is only as good as the work you put into using it. If you’re not reviewing costs and performance regularly, you can miss important changes — and you’ll run the risk of being overwhelmed by the amount of data you see when you finally do get around to checking in.
At a minimum, create quarterly reports, and shoot for monthly. You don’t want poor performance to fester into a real problem when it could have been corrected quickly.
4. Work with supply chain consultants or engineers.
Even with the right digital tools in your hands, you may still struggle to uncover all the insights your data contains. That’s where supply chain consultants come in.
These people have spent their careers digesting logistics data. They can help you see trends, create models to help you forecast future costs or performance, and even package your data for you to present with actionable insights to stakeholders.
Ask Our Supply Chain Experts to Dig Into Your Data
The supply chain consultants on our Coyote Transportation Management team bring a powerful mix of data science expertise and longtime logistics experience to every shipper they work with.
Want them to digest your data, compare it to both our proprietary internal data and industry sources you can’t access on your own, help you find actionable insights in it, and prepare you to report your strategic plan to your stakeholders? Schedule a meeting today to get started.


