

Q4 2024 Truckload Market Forecast: Spot & Contract Freight Rate Trends


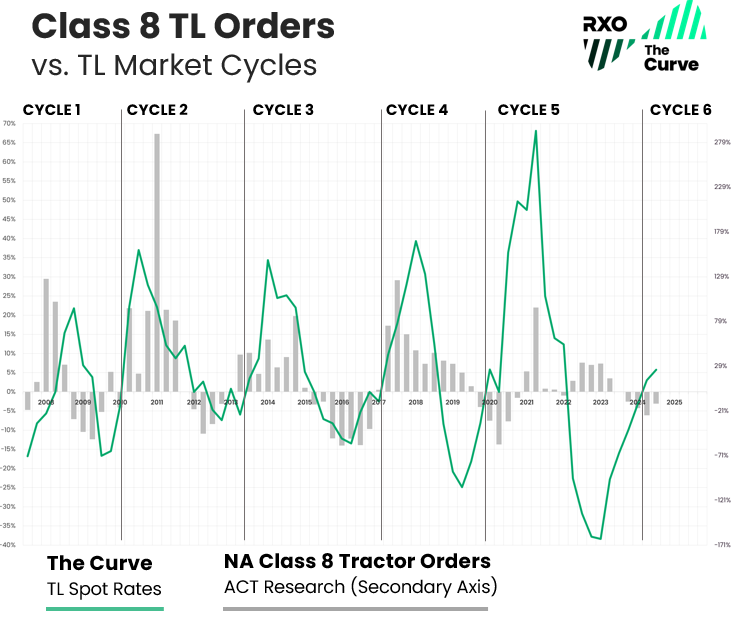
In our last quarterly update, the Curve index finally crossed the threshold, and we entered into an inflationary market — this ended the fifth market cycle (in our observed history) and kicked off the sixth.
While we may be back in an inflationary environment, it doesn’t exactly feel like it (at least not yet) for most logistics professionals.
What does that mean for shippers and carriers? Will 2025 actually bring back volatility to the market, or will it be a repeat of 2024?
We’ll tell you everything you need to know about the past quarter and what to expect throughout the rest of Q4 and beyond in the latest truckload market guide.
Q3 Truckload Market:
The Complete Guide for Logistics Pros
- Q3 trucking spot & contract rate recap
- Economic outlook: indicators that drive freight demand
- Trucking trends impacting the market
- Q4 truckload market forecast
New to the Curve?
These essential truckload market resources will give you foundational industry knowledge and teach you how how we build our proprietary spot rate index.
RXO & the Curve
RXO acquired Coyote Logistics in September 2024. As a new, combined company, we will not only continue publishing industry-leading insights (like the Curve) — we plan on making them even better. Now, as the now third largest 3PL in North America, we’ll have an even broader, richer dataset to analyze. We look forward to bringing you improved content in 2025.
Q3 2024 Spot & Contract Trucking Rate Recap
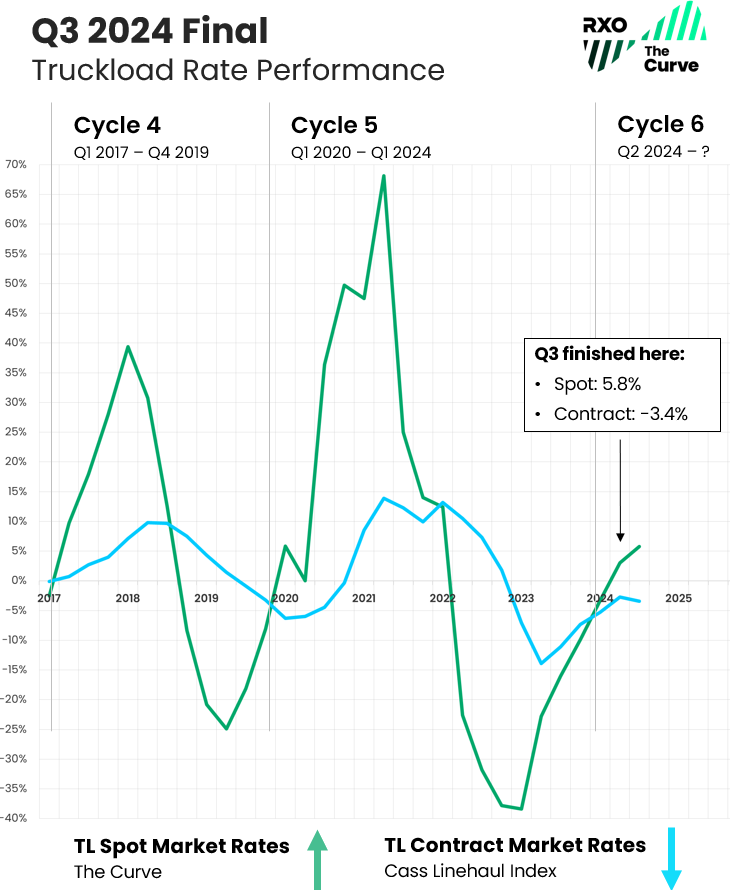
In Q3, the Curve continued its upward climb into Y/Y inflation, in-line with our prediction.
Download all the forecast charts as slides for your next presentation using the form to your right.
Q3 truckload spot rates continued their inflationary rise.
Truckload spot rates finished Q3 at 5.8% Y/Y, up from 3.0% in Q2.
Q3 truckload contract rates trended down.
Truckload contract rates* trended downwards to -3.4%, a dip from -2.7% Y/Y in Q2 2024.
Looking at previous cycles, trend lines are rarely linear, and kinks are common. Furthermore, contract rates usually lag spot rate activity by two to three quarters, so this slight downturn is still in-line with past performance. We expect contract rates to continue their upwards climb in the following quarters.
Actual Spot Truckload Rates vs. Y/Y
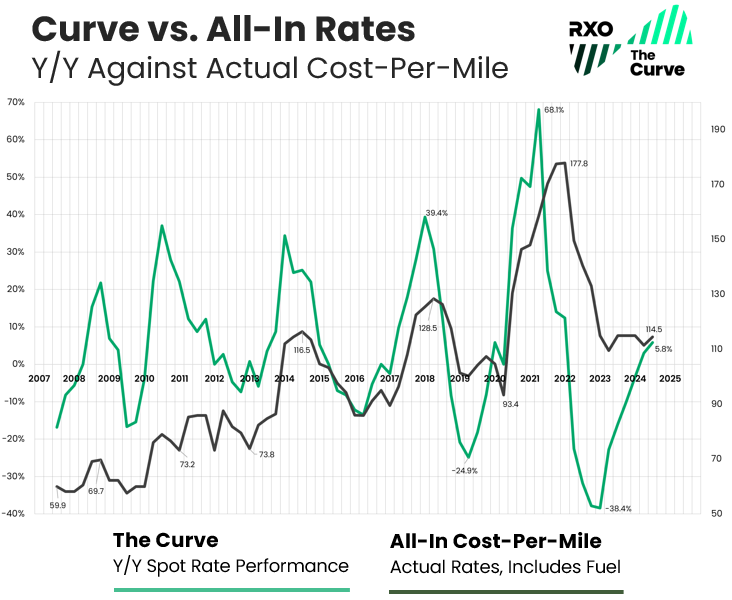
To build further confidence in the Curve (a Y/Y spot rate index), let’s see it up against our proprietary all-in cost-per-mile index — this is comparing annual change (without fuel) versus the actual rate (all-in cost, with fuel included).
(As a reminder, these numbers are informed by real transactional data from thousands daily shipments spanning over 17 years.)
Download all the forecast charts as slides for your next presentation using the form to your right.
If you feel like the market has been stagnant, you’re not wrong — our all-in index has remained essentially flat for most of the past two years.
Even recent major shipping events (Labor Day, a short-lived port strike, back-to-back hurricanes) failed to drive a major change.
In previous truckload market cycles, when shipping events hit during the upswing to inflation, they tend to accelerate market activity. Though we observed a slight rate bump and some regional volatility, we failed to see a sustained push upwards.
The cost-per-mile index may have found the bottom, but it’s still only hovering around levels from the 2014 peak.
That means, in absolute terms, carriers are currently getting similar spot rates to nine years ago, though their operating costs (diesel, insurance, labor, etc.) have increased substantially. Simply put, there is no room for rates to drop, as many carriers have been running at unsustainable levels.
With continued attrition in the carrier market, it’s likely we’ll continue to see this index head up as well in the coming quarters.
Q3 2024 Truckload Market Recap
The Curve (measuring Y/Y change in spot rates) continued its upward climb for the sixth straight quarter, though all-in rates (actual amount paid to carriers) remained relatively flat (and have since early 2023).
Though we headed higher into an inflationary rate environment, Q3 was still primarily a shippers’ market, and major events (hurricanes, holidays) had little impact to rates as a whole.
Carriers remained under significant cost pressure, while shippers enjoyed high tender acceptance, easy capacity and slight rate decreases in their RFPs.
Key Economic Indicators Driving the Truckload Market
Through Q3 2024, the economy isn’t receding, but it isn’t roaring back either.
This relative stagnation across macroeconomic indicators means depressed truckload volumes, which have slowed down a freight market recovery.
It’s worth noting that though the truckload market is linked to what happens in the wider economy, it is not always coupled (see the inflationary Curve in 2008 during the Great Recession).
Given how supply and demand work in the truckload market, it’s possible for the economy to remain strong and the truckload market to languish (and vice versa).
Let’s examine the most recent available figures for industrial production, consumer spending, imports and inventories through the lens of how they are impacting truckload shipping.
Download all the forecast charts as slides for your next presentation using the form to your right.
Personal Consumption Expenditures
- What is it?
How much the American consumer is spending. - How it impacts truckload shipping:
The more we buy, the more we need to produce (IP) and/or buy elsewhere (imports), which translates to greater demand for truckload shipping.
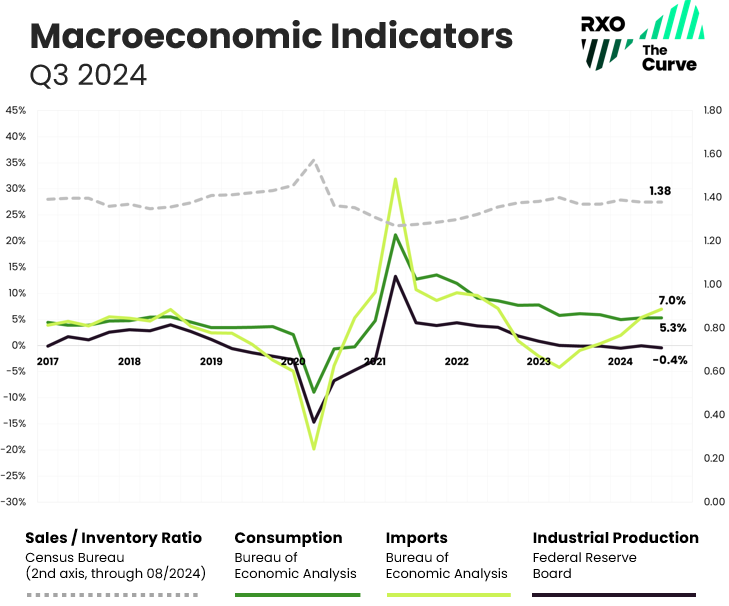
Throughout persistent inflation and fears over a possible recession, consumer spending has remained stable, helping to buoy the overall economy. Though the rate of growth has steadily slowed since Q4 2021, it is still growing — through Q3 2024, PCE is at 5.3% Y/Y, up slightly from 5.2% in Q1.
However, it’s worth noting the balance between physical goods consumption and services. When COVID struck, service-related industries closed and demand for physical goods soared to 15-year highs in an incredibly short period of time, driving a corresponding inflationary spot market.
Over the past several years post-COVID, consumers are spending more money on services (vacations, dining, entertainment, etc.), decreasing physical goods’ share. While overall spending on goods was up 2.8% Y/Y in Q3, spending on services increased even more (6.9% Y/Y), and the goods’ share of total spending continued to decline.
We’ll look for any increase in this to drive more freight demand in the coming months.
Industrial Production (IP)
- What is it?
Total value of physical goods America is producing. - How it impacts truckload shipping:
The more we make, the more freight that needs to move, from raw material inputs to finished goods.
Though IP, like consumer spending, has trended downward for several quarters, it is still stable. Through Q3 2024, the index sits at -0.4% Y/Y, down slightly from Q2.
While we don’t anticipate a large uptick in production (that would increase overall truckload volumes), as long as it remains stable, demand is not very likely to decrease either.
Imports (Goods Only)
- What is it?
Total value of physical goods America is buying from other countries. - How it impacts truckload shipping:
The more we buy from other countries, the more freight that needs to move, from raw material inputs to finished goods.
Imports (of goods, excluding services) ended Q3 at 7.0% Y/Y. The slight uptick in imports are encouraging signs for increased freight later in the year.
It’s also possible that we’ll see a short-term spike in imports in the coming quarter, as international shippers try to pull in more inventory ahead of any potential tariff-related and/or potential port strike volatility.
Inventory-to-Sales (through August)
- What is it?
The ratio of physical goods businesses have in stock vs. how much they’re selling. - How it impacts truckload shipping:
When inventory levels are high, it creates a delay in demand for truckload shipping, as businesses will work off excess inventory before producing new goods (IP) or buying more goods (imports).
After pandemic-related supply chain disruptions wrought havoc to shippers’ inventories, many began to stockpile in an effort to combat volatility and meet demand.
Throughout 2023, many businesses tried to shed inventory amidst falling demand and rising interest costs.
After peaking at 1.40 in December 2022, the index has trended down slightly, staying between 1.36 and 1.39 for every month since then — through August (most recent available), the index is sitting at 1.38.
With the index remaining stable for the past year, it’s likely the inventory destocking efforts were successful. There are also signs that some restocking has been underway over the past couple quarters leading up to Q4 shipping.
Macroeconomic Takeaway
Nothing much has changed since Q2 — all the major indices are essentially flat, with a slight increase in imports being the exception.Despite continued headwinds over the past year, the U.S. economy seems to have stubbornly avoided a recession.
Though we are still clawing out of a freight recession, the truckload cycle will continue its course.
The last time the cycle went inflationary (2020 – 2021), incremental freight demand drove rate growth. For this inflationary leg, the macroeconomic outlook still doesn’t support a massive spike in demand.
Instead, supply-side constraints (carrier attrition) will likely be the driving force.
Truckload Market Trends to Watch in Q4
We have climbed out of the trough of the truckload market cycle and heading higher into Y/Y inflation. Let’s unpack a few of the key trends impacting the market before we dive into the updated Q4 forecast.
1. Spot and contract rates are still comparable (for now).
For the past couple years, shippers have used their transportation RFPs as opportunities to bring their contract rates (aka primary rates) back toward pre-pandemic levels.
And they were largely successful — we have seen the longest stretch of discounted spot rates compared to contract rates in history, lasting over two-and-a-half years.
Even though spot rates have already bounced off the bottom, many companies are still trying to get in one last round of reductions.
Those rates and routing guides set in the softer market of 2024 may not survive a tighter market in 2025, when the spot market will (likely) become more lucrative than the contract market.
We’ve already seen that in Y/Y terms, and have started to see it in absolute terms over the summer holiday shipping surges, though rates couldn’t sustain momentum.
As we get into the holidays and the two diverge further, it will create tension across routing guides as carriers look to move more drivers into the spot market. We’ll see the shift from a shipper’s market back to a carrier’s market begin.
2. Private fleets are soaking up for-hire freight.
In an effort to combat the unprecedented volatility of 2020 and 2021, shippers made a move to create or expand their private fleets.
This added a lot of resilience in the form of guaranteed capacity and predictable rates, but with the overall downturn in freight volumes, there was a lot of slack in the line.
This excess private fleet capacity has soaked up a lot of freight that would have otherwise hit the for-hire spot market.
Until shipping volumes meaningfully pick up, shippers wind down their private fleets, or (most likely) the for-hire market continues to shrink, it will act as a bulwark against spot rate growth and prolong the softer market conditions.
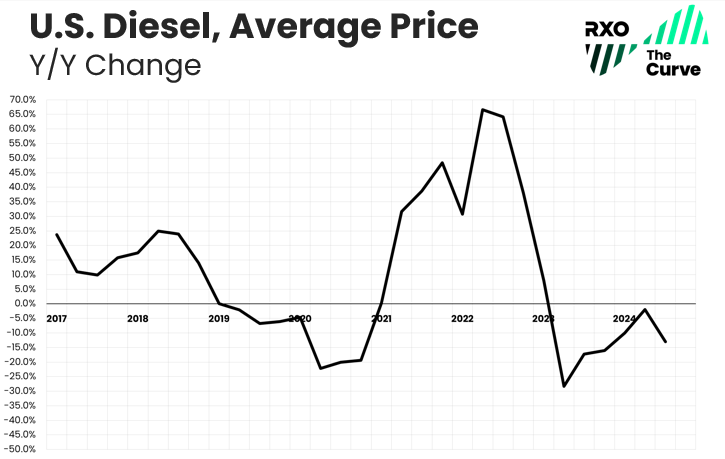
3. Fuel prices are stable, throttling rate inflation.
Diesel has been on a wild ride over the past several years.
From 2015 to 2022, diesel, with a few exceptions, averaged between $2.50 and $3.50 / gallon.
In 2022, it ballooned up to $5.70, dropped to $3.80 in 2023, shot up to $4.60 late in 2023, then has been dropping down for most of 2024, hovering around $3.60.
Why does that matter?
Diesel fuel, which represents around 30% of a carrier’s overall cost, can have a huge impact on a trucking company’s profitability if it rises or falls faster than freight rates.
Many carriers were able to absorb historically high fuel costs in 2022 due to historically high rates. That hasn’t been the case for some time.
If fuel gets more expensive (e.g., if another geopolitical event to an oil-producing nation like we saw with the Russian invasion of Ukraine in 2022), we’ll see a faster rise to inflation as carriers can no longer absorb the increase.
Since it has been stable, we’ve seen a lower rise to the upside.
4. Carriers are buying fewer trucks.
After remaining positive for six consecutive quarters (despite spot rates dropping for over a year), in Q4 2023, the bottom finally fell out for truck orders.
Q3 2024 was another continuation of the trend, as Class 8 tractor orders (as tracked by ACT Research) were down -13% on a Y/Y basis.
This is another indicator showing the financial strain on the supply base — carriers have caught up to COVID-era backlogs, and the need for incremental capacity, or the ability to turn over old equipment, is lessening.
5. Carrier employment continues to wane.
Throughout most of 2023 and into 2024, driver employment figures remained curiously strong, despite weaker market conditions.
As freight volumes dropped, many drivers flocked to the security of larger fleets who were more exposed to lucrative contract freight.
As these drivers shifted from owner-operators (who don’t show up in payroll data) to W2 employees at fleets, it boosted employment data from the Bureau of Labor Statistics (BLS) even though the actual amount of capacity in the market was either flat or down.
Throughout most of 2024, we’ve started to see carrier attrition show up in employment numbers, and continue to see more attrition over the past few months. We expect that continue as the full Q3 figures roll in.
All Employees, Truck Transportation (from the BLS, through September)
- Decreased sequentially for six consecutive months.
- Decreased Y/Y every month this year except August (the 2023 Yellow bankruptcy causing the one exception).
Production & Non-Supervisory Employees, Long-Distance Trucking (aka Drivers, from the BLS, through August)
- Decreased sequentially for four of the past five months.
- Decreased Y/Y every month this year except August (the 2023 Yellow bankruptcy causing the one exception).
Operating Authorities (from the FMCSA)
- There was a net decrease of 1,739 operating authorities in September.
- The population has declined in 22 of the past 24 months, leading to a total decrease of ~47,000 operating authorities over that time frame (for context, there were around 100,000 additions from 2020 to 2022).
Truckload Trends Takeaway
Not much has changed since Q3: Though freight volumes are sluggish, there are signs of carrier attrition in employment and authority revocations.
The speed and severity of the upward climb will depend on how fast carrier capacity exits the market, but after weak Q3 freight volumes, decreasing contract rates setting in, it will likely speed up in Q4.
Q4 2024 Truckload Market Forecast
We’ve covered the macroeconomic environment, and key trends — but where does it leave us going forward?
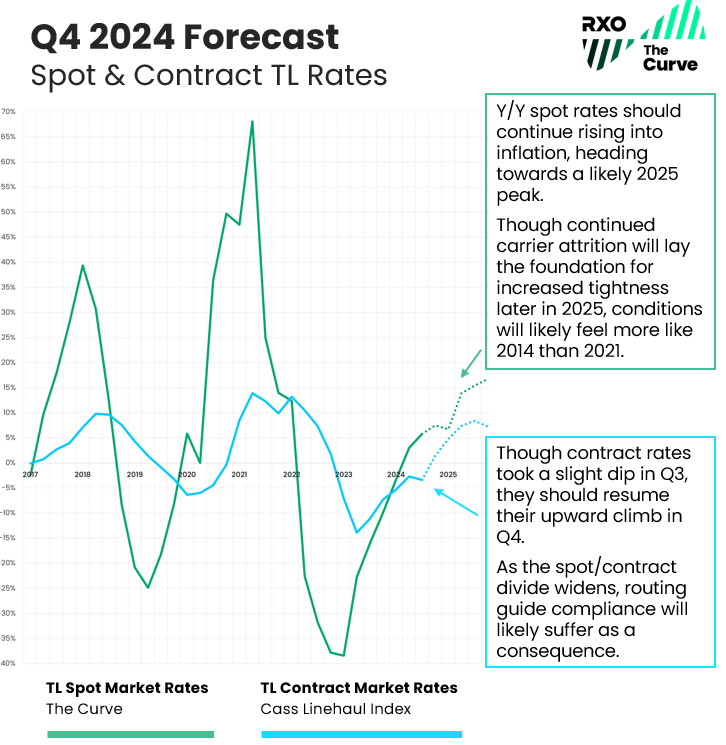
We predict the Curve will continue it’s move into inflation, driving toward a peak in 2025.
Though capacity and rates might feel stable, we are in a changing environment.
We continue to see carrier capacity leave the market (albeit somewhat slowly). Also, with bid rates continuing to come in lower and spot rates trending higher, the divergence will drive volatility as cash-strapped carriers look to increase profitability after a very difficult two years.
All that said, while we are in an inflationary market, we don’t anticipate the sort of extreme conditions we experienced in the last inflationary market in 2020 and 2021.
Based on recent history and current market dynamics (shrinking but still available capacity, stable demand), it’s quite possible we’ll see a lower potential market peak.
For guidance, a look back to 2014 would likely be a better comparison.
We may still get a more traditional peak if we experience any combination of an increase in demand, a faster-than-expected exit of carriers, a robust peak season coupled with winter storms, or a spike in diesel, but we think a conservative outlook more likely.
Forecast Takeaway
We are in an inflationary spot market, heading to a market peak in 2025.With contract rates remaining Y/Y deflationary, spot rates will overtake contract. This dynamic will create pressure for shippers in the coming months.
While Q4 might not feel like a dramatically different operating environment, we are in a changing marketplace that is setting us up for a more meaningful flip next year.
What Can You Do?
Don’t be too aggressive in rate cutting.
Though tempting, be prudent about where you cut rates and trim capacity — we believe 2025 will look different than 2024.
Short-term gains today could cost you in the spot market tomorrow.
Keep core freight providers in the game.
Even if you have limited volume and need for them now, if you think you’ll need them in a tight market, keep them engaged in your routing guide.
Now is the time to maximize planning and communication with the vendors you care about most.
Get your KPIs in order.
It’s easy to slack off when rates are low and service is high. Get ready for a tougher market by setting and communicating your KPIs with your carriers. Make sure you have a good carrier scorecarding system in place.
If you need to brush up on transportation benchmarks, check out our research study on logistics KPIs.
Continued Learning: Truckload Market 101
These three helpful resources will help you learn about truckload market fundamentals and how we build our proprietary index.
If you’re new to the Curve, take a few minutes to familiarize yourself with this foundational content:
Part I: Supply & Demand 101: Basics of Truckload Market Economics
Part II: Understanding the U.S. Truckload Market
Part III: Explaining the Curve
*We use the Cass Truckload Linehaul index as a proxy for contract rate performance.
Want the Forecast Charts for Your Next Presentation?
Fill out this brief form to download all charts from this quarter’s truckload market guide as slides.