Q3 2023 Spot & Contract Truckload Rate Trends
In our last quarterly update, we saw the Coyote Curve® index trend downwards for the seventh straight quarter.
But the rate of decline levelled off significantly, and we predicted that Q2 would, finally, be the turn of the tide.
The Q2 numbers are in.
The U.S. truckload market has finally stopped digging and we’re heading back towards inflation — what exactly will that mean for shippers and carriers?
We’ll tell you everything you need to know in the Q3 Truckload Market Guide.
Q3 Truckload Market:
The Complete Guide for Logistics Pros
- Q2 Trucking Spot & Contract Rates Recap
- Economic Outlook: How Indicators Are Driving Demand
- 5 Trends Impacting the Market in Q3
- Q3 Truckload Market Forecast
- Download the Forecast Slides
New to the Coyote Curve?
These essential resources can help you build foundational knowledge on the truckload market and our proprietary spot rate index.
Q2 2023 Spot & Contract Trucking Rate Recap
Last year, the balance of supply and demand in the truckload market tipped away from carriers, and we entered into a shipper’s market — plenty of available carrier capacity, declining freight volumes, and declining spot rates.
Our index flipped to year-over-year (Y/Y) deflationary in Q2 2022, dropped to a new low in Q4, then kept digging again in Q1 2023.
But the rate of descent slowed considerably, and we predicted Q2 was the turn of the tide.
With Q2 in the books, we can now safely say that we have hit the deflationary trough of the truckload market cycle, and are on the way back up.
Though we are still deep in Y/Y deflation, and shippers and carriers will not likely notice a significant impact to pricing and capacity in the immediate future, these initial signs of life in the spot market could signal a stronger truckload market in the second half of the year.
Let’s take a closer look at the final results.
Download all the forecast charts in slide format for your next presentation.
Q2 Truckload Spot Rates Have Bounced off the Bottom
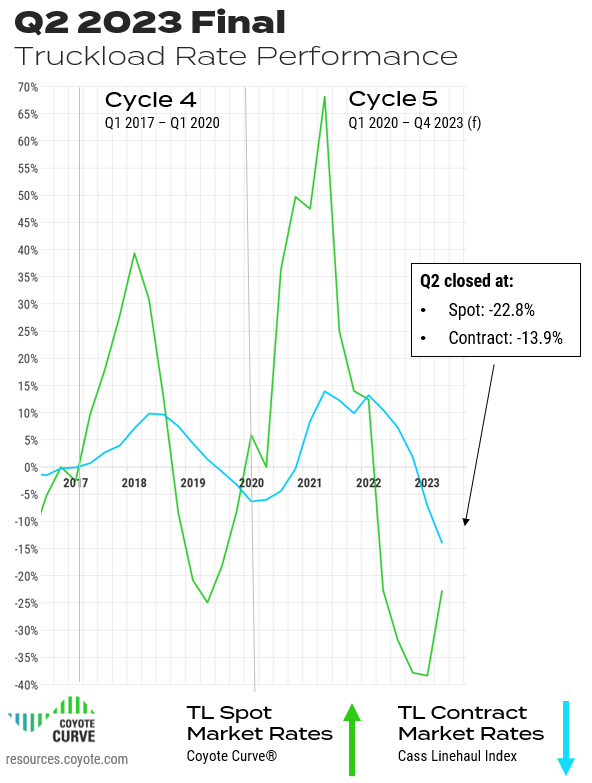
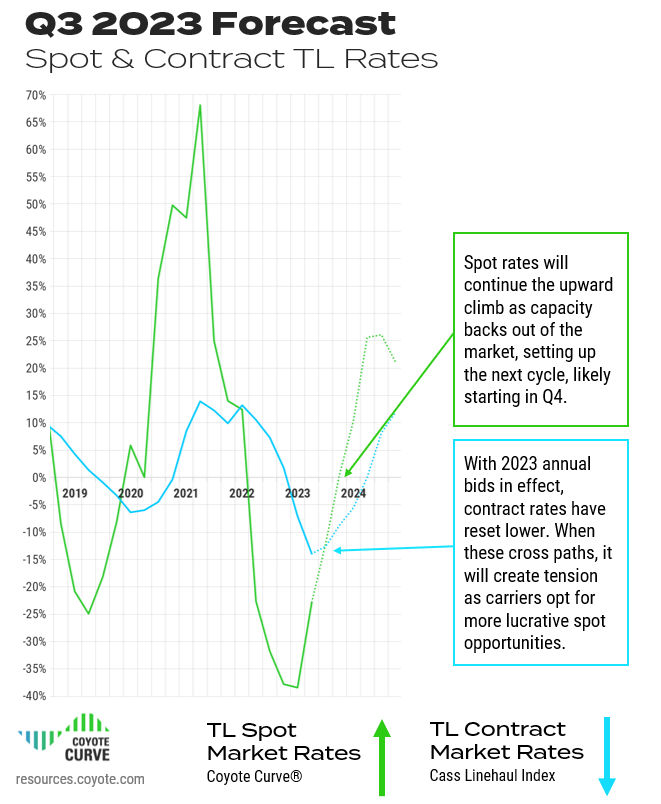
Truckload spot rates finished Q2 at -22.8% Y/Y, up from -38.4% in Q1.
Q2 Truckload Contract Rates Dove Deeper Into Deflation
Truckload contract rates* dropped to -13.9% Y/Y in Q2, down significantly from -7.1% in Q1 2023.
This is typical for this phase of the cycle (contract behavior typically lags spot by 2-3 quarters).
The relative increase in spot rates versus the decline in contract rates will be a key metric to watch, as a significant divergence between these two will create pricing and capacity pressure on shippers.
All-In Spot Truckload Rates vs. Y/Y
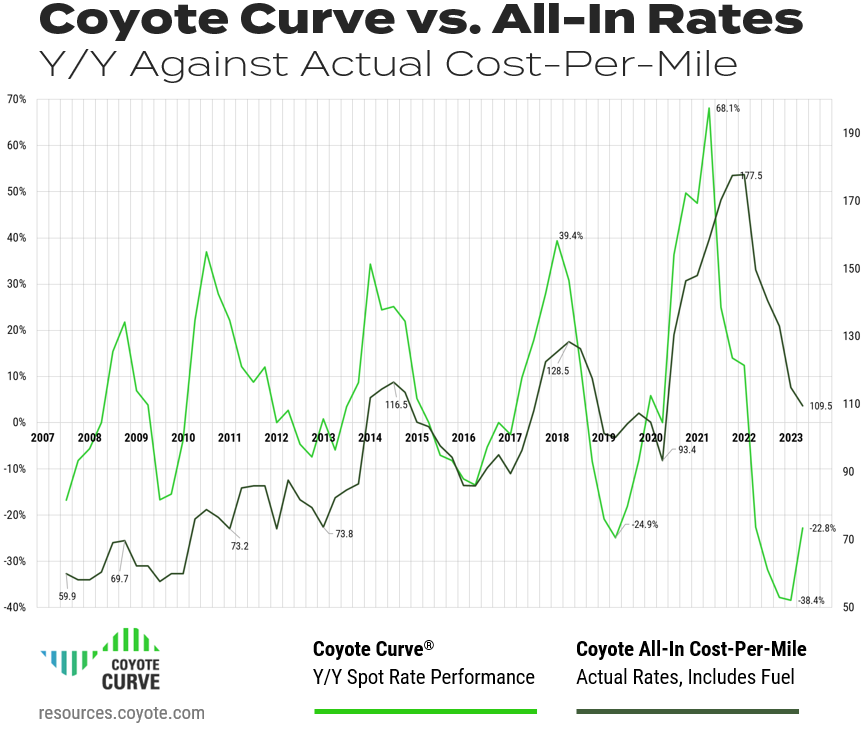
To build further confidence in the Coyote Curve Y/Y spot rate index, let’s see it up against our proprietary all-in cost-per-mile index — this is comparing annual change versus the absolute rate.
(As a reminder, these numbers are informed by real transactional data from over 10,000 daily shipments spanning over 15 years.)
Download all the forecast charts in slide format for your next presentation.
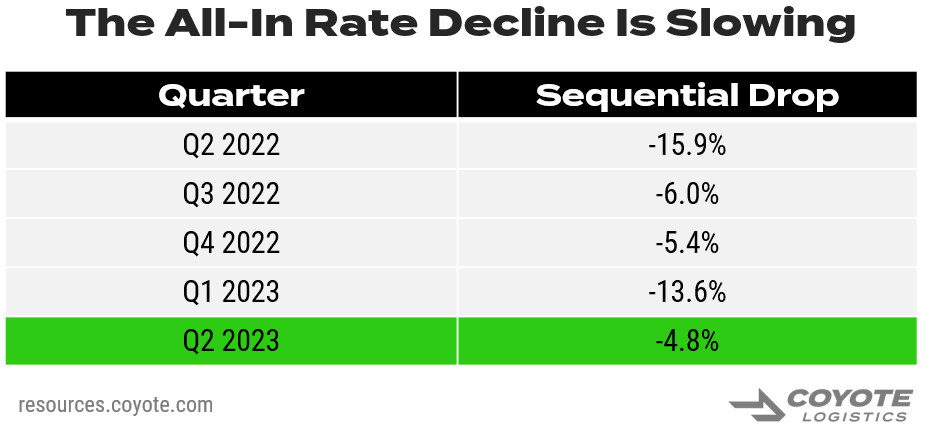
Though all-in rates declined sequentially (again), they are showing signs of levelling out after dramatic decreases over the past year.
With inflation impacting other areas of carriers’ cost structures (diesel, insurance, labor, etc.) — there is just not much room left for rates to drop, as many carriers are running at unsustainable levels.
Once 4th of July, the rest of produce season, back-to-school and Labor Day shipping are all accounted for in the Q3 finals, expect to see actual rates increase as well, not just the year-over-year comparisons.
Q2 2023 Truckload Market Recap
After seven straight quarters of rate deceleration, we finally hit the turning point.
While rates are still well into year-over-year deflation, the index is on the way up (with a little help from DOT Week and Memorial Day shipping bumps).
That said, many carriers are still under financial stress, which will lead us to the next inflationary leg of the cycle.
Key Economic Indicators Driving the Truckload Market
For the past year, the burning question has been, “Is the U.S. economy going to tip into a recession, or will we have a soft landing?”
After hitting a high-water mark of 9.1% in June 2022, one year later the Consumer Price Index dropped to 3%, its lowest figure since Q1 of 2021.
While there are still several economic headwinds, there are also signs of hope for a soft landing (strong employment, stable spending).
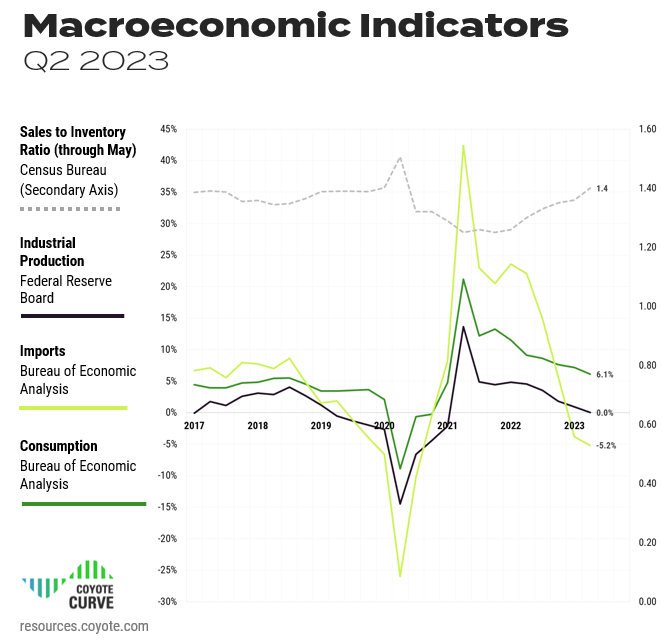
Let’s examine the most recent available figures for industrial production, consumer spending, imports and inventories through the lens of how they are impacting truckload shipping.
Note: Keep in mind that though the truckload market is linked to what happens in the wider economy, it is not always coupled (see the Curve in 2008 during the Great Recession).
Download all the forecast charts in slide format for your next presentation.
Personal Consumption Expenditures
- What is it?
How much the American consumer is spending - How it impacts truckload shipping:
The more we buy, the more we need to produce (IP) and/or buy elsewhere (imports), which translates to greater demand for truckload shipping.
Despite persistent inflation and fears over a possible recession, consumer spending has remained stable, helping to buoy the overall economy.
Though the rate of growth has slowed (Y/Y spending is on track to decline for the eighth straight quarter), it is still growing — PCE stands at 6.1% for Q2.
Industrial Production (IP)
- What is it?
Total value of physical goods America is producing - How it impacts truckload shipping:
The more we make, the more freight that needs to move, from raw material inputs to finished goods
Though IP has been trending downwards for several quarters, and inching closer to Y/Y negative territory, it remains stubbornly positive — through Q2, the index is at 0.02% growth Y/Y.
While we don’t anticipate a large uptick (that would increase overall truckload volumes), as long as it remains stable, demand won’t likely get any worse either.
Imports (Goods Only)
- What is it?
Total value of physical goods America is buying from other countries - How it impacts truckload shipping:
The more we buy from other countries, the more freight that needs to move, from raw material inputs to finished goods
With chaos in international shipping markets over the past two years, this indicator has been particularly volatile.
After hitting a high of 44.9% last year, imports (of goods, excluding services) were down to 5.7% Y/Y at the end of Q4 and -3.8% Y/Y at the end of Q1 2023.
Though Y/Y imports dropped again, the rate of decline levelled off significantly, and Q2 ended at -5.2%.
Keep in mind, the 2022 comparisons are tough, with Q2 2022 marking an all-time high. Looking at pre-pandemic figures, current goods import totals are still elevated.
Inventory-to-Sales (Through May)
- What is it?
The ratio of physical goods businesses have in stock vs. how much they’re selling - How it impacts truckload shipping:
When inventory levels are high, it creates a delay in demand for truckload shipping, as businesses will work off excess inventory before producing new goods (IP) or buying more goods (imports).
Over the past two years, to combat overall supply chain volatility and high demand, shippers built up their inventories.
Despite many businesses trying to shed inventory amidst falling demand and rising interest costs, Q1 finished at 1.36, increasing for the sixth straight quarter.
Through May, the index is trending (1.4), but remained flat from April to May. Hopefully we’ll see a reverse of course as the full Q2 figures come in. If companies are able to de-stock, we could see that pay off with increased imports and production later in the year.
Macroeconomic Takeaway
There are some hopeful signs for a soft landing (vs. a recession), and the overall economic outlook is more positive than three months ago.Regardless, the truckload cycle will continue its course.
The last time the cycle went inflationary (2020 – 2021), incremental freight demand drove rate growth. For the upcoming inflationary leg, the macroeconomic outlook doesn’t support a huge spike in demand.
Instead, supply-side constraints (carrier attrition) will likely be the driving force.
Truckload Market Trends to Watch in Q3
We have reached the bottom of the truckload market cycle and are on the way back towards Y/Y spot rate inflation.
What remains to be seen is how long will it take.
Let’s unpack a few of the key trends impacting the market before we dive into the updated Q3 forecast.
1. Freight volumes are lagging.
As we covered in the macroeconomic analysis, we’re seeing a sluggish demand environment for truckload shipping.
Though freight volumes usually pick up Q2 with seasonal produce and summer shipping, we did not see a material uptick in volumes.
If we get a larger spike in Q3 ramping up for peak season, this would bring about a faster bounce back to inflation, as demand would spike relative to current supply.
2. Fuel prices are stabilizing.
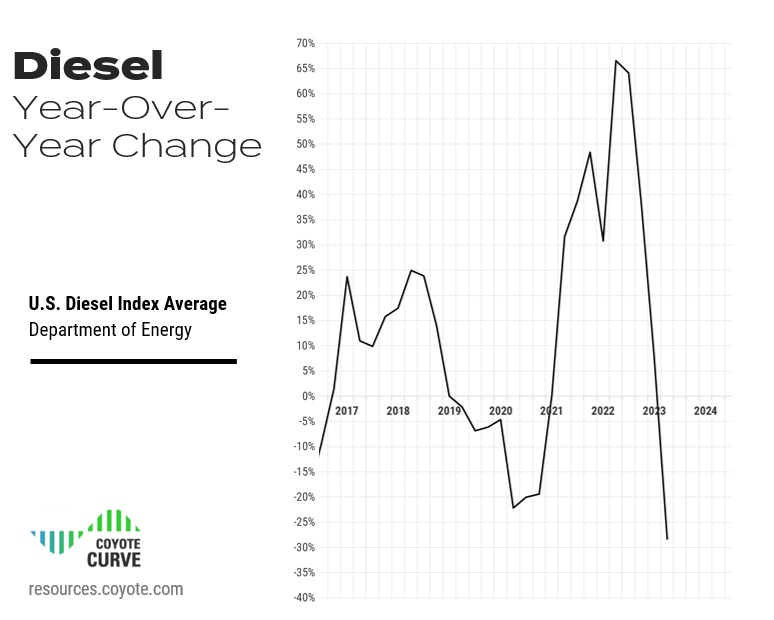
After historically high diesel rates in 2022, this year has seen a significant drop.
In Q2, diesel was down 28.3% Y/Y, but keep in mind that was compared to the peak.
June averaged $3.80 / gallon, the lowest since January 2022, but still higher than pre-pandemic rates (full year 2019 average was $3.06).
Diesel fuel, which represents around 30% of a carrier’s overall cost, can have a huge impact on a trucking company’s profitability if it rises or falls faster than freight rates.
Though on its surface it may seem like a welcome trend, the drop in fuel has also contributed to the drop of the floor for spot rates. With falling diesel, carriers have been able to absorb a little lower rates, prolonging the deflationary leg of the cycle.
However, if fuel reverses course and gets more expensive, we’ll see a faster rise to inflation. And while many carriers absorbed higher fuel costs in 2022, that will not likely happen again given current market conditions.
3. Carriers keep buying trucks.
Though the worst of COVID-era supply chain shortages are in the rear view, we’re still dealing with the aftermath.
There is a lot of pent-up demand from carriers for new trucks.
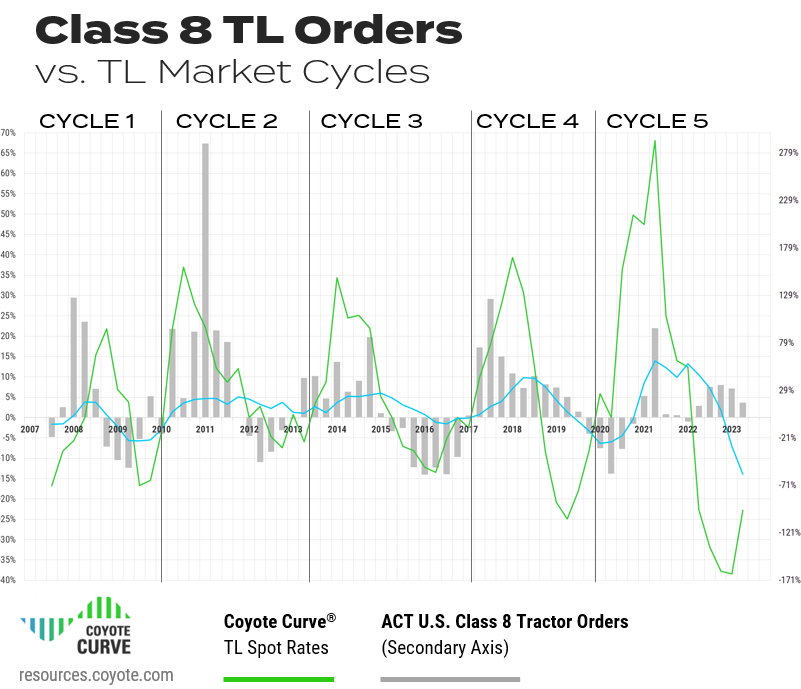
Q2 2023 Class 8 tractor orders (as tracked by ACT Research) were up 16% on a Y/Y basis, and even up 11% sequentially (Q1 vs. Q2) — both of which are atypical for this point in the cycle.
Spot rates have been dropping for over a year, which historically leads to a decline in orders.
What we’re seeing now is not likely incremental demand, but existing demand that can finally be met.
Even with higher cost of capital and a slow year in spot rates, many larger fleets had cash reserves from two record years, and are snatching up build slots to turn over aging tractors.
When the market does tighten back up, there will be enough trucks to support increased shipper demand — the question will be: are there enough drivers?
4. Spot and contract rates will eventually converge.
Rates from 2023 bid season are now fully implemented and, as expected, shippers used this transportation RFP as an opportunity to bring their contract rates back towards pre-pandemic levels.
Carriers that had been running freight on contract (or primary) rates were netting a significant premium to the spot market.
Now that most contract rates have reset from 2023 annual bids, carriers (especially larger ones more exposed to contract freight) are feeling an increased crunch to their margins.
As we approach the next inflationary leg of the cycle, Y/Y spot rates will shoot up — we do not anticipate the same for contract rates.
In 2024 (perhaps even sooner), these two indices (spot and contract) will eventually cross paths.
And when they do, spot rates will be more lucrative than the contract market, both in Y/Y and absolute terms.
This will create tension across routing guides as carriers look to move more drivers into the spot market, and we’ll start to see the shift from a shipper’s market back to a carrier’s market.
5. Carrier Employment
While the supply side of the industry is certainly feeling the pressure, there is a stat that has remained curiously strong: driver employment.
- Driver employment has been trending up.
Though the market has been soft for the past year, long-haul driver employment is still well above pre-pandemic levels. After peaking in January, employment started dropping sequentially in February and March, but has ticked back up in April and May. - But motor carrier authority revocations are also trending up.
Counterintuitively, more carriers seem to be exiting the market, according to FMCSA authority revocation data.
What is likely happening.
When spot rates were hitting all-time highs in 2021 and 2022, many drivers opted to become owner-operators or drive for smaller fleets heavily exposed to spot market freight (as it paid more).
Now that the tables have turned, many smaller carriers without access to capital are having cash flow concerns.
Drivers are likely shifting over to larger fleets (with exposure to the contract market) for more stable, consistent freight. So though some capacity has left the market, a lot of it may be shifting from one carrier to another.
Truckload Trends Takeaway
The market is heading back toward Y/Y inflation, but the speed and severity of the upward climb will depend on a variety of factors.
Over the next quarter, any combination of the following would contribute to a faster inflationary move:
- A spike in diesel prices
- Stronger truckload volumes for peak season buildup
- The continued drop of contract rates
- Continued increase in authority revocations
- A decrease in driver employment
Q3 2023 Truckload Market Forecast
We’ve covered the macroeconomic environment, and key trends — but where does it leave us going forward?
Let’s look at the forecast.
Download all the forecast charts in slide format for your next presentation
We have hit the bottom of the truckload market cycle, and do not think it’s going anywhere but up from here.
Throughout Q3, we believe that contract rates will continue to remain deflationary until well into 2024, driver employment growth will reverse course, carrier attrition will increase, and we’ll see a relative bump in shipping volume for peak season preparation.
All this will lead us back into an inflationary truckload market by Q4.
That doesn’t necessarily mean a dramatically different environment over the next quarter — looking at Y/Y comparisons, rates do not have to increase very much on an actual basis to put the Curve back into an inflationary environment.
Forecast Takeaway
We have bounced off of the bottom and on our way back to an inflationary spot market, which we will likely hit in Q4.Contract rates, conversely, will likely remain in Y/Y deflation for several more quarters.
We don’t anticipate a dramatically different operating environment in Q3, but the market should start to incrementally tighten, setting up the next inflationary leg in 2024.
What Can You Do?
There is no silver bullet or special trick, it comes down to fundamentals.
Use the (relative) lull in shipping environment to maximize planning and communication with your core freight providers.
Now more than ever, be prudent about where you’re cutting rates and trimming capacity — we believe that the end of 2023 and early 2024 will look different than the past several quarters.
Short-term gains today could cost you in the spot market tomorrow.
Want to Know How Your Peers Are Working With Providers?
You can get insights from 500 shippers with our latest research study on supply chain outsourcing.
Read The Outsourcing Study Now
Continued Learning: Truckload Market 101
These three helpful resources will help you learn about truckload market fundamentals and how we build our proprietary index.
If you’re new to the Coyote Curve, take a few minutes to familiarize yourself with this foundational content:
Part I: Supply & Demand 101: Basics of Truckload Market Economics
Part II: Understanding the U.S. Truckload Market
Part III: Explaining the Coyote Curve
*We use the Cass Truckload Linehaul index as a proxy for contract rate performance.


