Q2 2023 Truckload Market Forecast: Spot & Contract Rate Trends
In our last quarterly update, we saw the Coyote Curve® index trend downwards for the sixth straight quarter.
The Q1 numbers are in.
Did Q1 make it the seven quarters in a row, or is the U.S. truckload market finally ready to stop digging? And how are the results of 2023’s bid season impacting the market?
We’ll tell you everything you need to know in the Q2 Truckload Market Guide.
Q2 Truckload Market:
The Complete Guide for Logistics Pros
- Q1 Trucking Spot & Contract Rates Recap
- Economic Outlook: How Indicators Are Driving Demand
- 5 Trends Impacting the Market in Q2
- Q2 Truckload Market Forecast
- Audience Poll: What the Market Thinks
- Download the Forecast Slides
New to the Coyote Curve?
These essential resources can help you build foundational knowledge on the truckload market and our proprietary spot rate index.
Q1 2023 Spot & Contract Trucking Rate Recap
In 2022, the balance of supply and demand in the truckload market tipped in favor of shippers, with the market flipping deflationary in Q2 and dropping to a new low in Q4.
Unfortunately for carriers, the new year did not bring on a new dynamic, and Q1 2023 proved to be a continuation of 2022 trends: plenty of available carrier capacity, declining freight volumes, and declining spot rates.
While spot rates did drop again in Q1, we think we may have found the trough of this truckload market cycle.
Trucking Rates Continued to Fall, But the Descent Has Slowed to a Halt
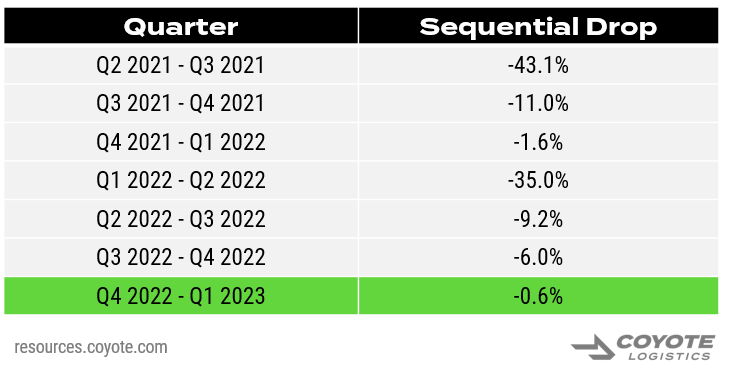
We continued to see a deceleration in the downward trend, signaling we’re near the deflationary inflection point (or have already passed it).
The Q1 2022 to Q2 2022 drop was one of the most dramatic we’ve ever recorded, but in Q3, it slowed to around 9% quarter-over-quarter (Q/Q).
In Q4, it slowed again to 6% Q/Q, and looking at the Q1 2023 finals, the index was basically flat.
Let’s take a closer look at the final results.
Download these charts as high resolution slides for your next presentation.
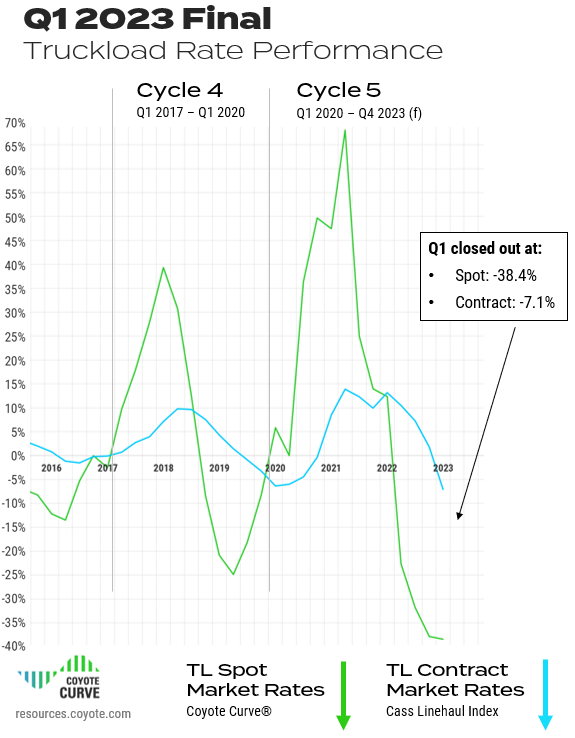
Q1 Truckload Spot Rates Stayed Deflationary
- TL spot rates at the end of Q1: -38.4
- Down from -37.8% Y/Y deflation in Q4 2022
Q1 Truckload Contract Rates Finally Broke Deflationary
- TL contract rates*: -7.1%
- Down significantly from 1.8% in Q4, and the biggest Y/Y downturn in history
- This is typical for this phase of the cycle, as contract behavior typically lags spot by 2-3 quarters
All-In Spot Truckload Rates vs. Y/Y
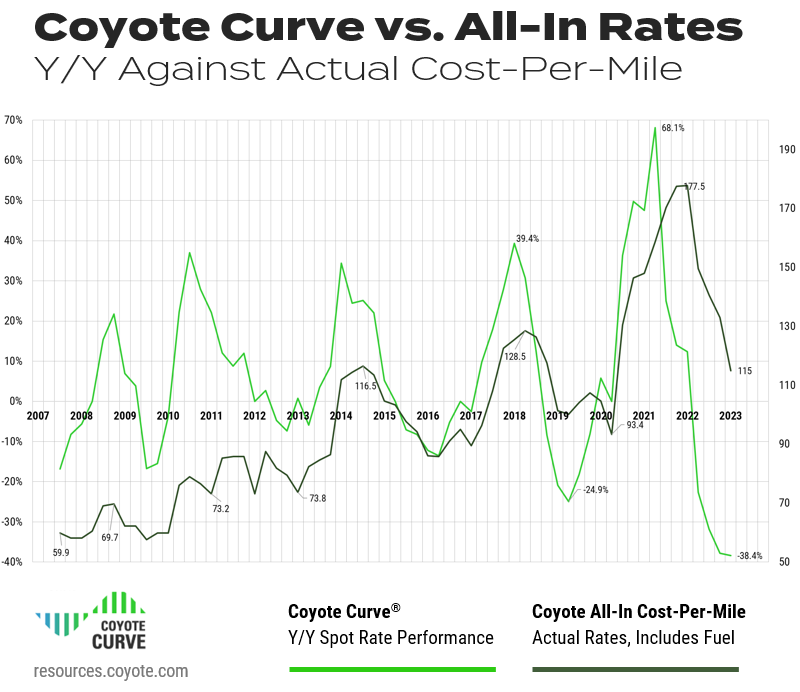
To build further confidence in the Coyote Curve Y/Y spot rate index, let’s see it up against our proprietary all-in cost-per-mile index — this is comparing annual change versus the absolute rate.
(As a reminder, these numbers are informed by real transactional data from over 10,000 daily shipments spanning over 15 years.)
Our Cost-Per-Mile index has finally dropped back below pre-pandemic levels.
Though still around the peaks of previous truckload cycles, the rate deflation is now showing up in both year-over-year and absolute terms.
While this is certainly welcome news for shippers, carriers — who are still experiencing inflation across other areas of their cost structure (diesel, insurance, labor, etc.) — are feeling the crunch.
Download these charts as high resolution slides for your next presentation.
Q1 Takeaway
We forecasted that Q4 2022 would be the turning point, yet Q1 saw our index drop lower (again).
However, the pace of spot rate deceleration has slowed to a halt. We have almost certainly hit the bottom, as most annual bids are done (resetting much lower) and spot rates can’t go much (if any) further down.
This dynamic is placing extreme financial stress on carriers, which will lead us to the next inflationary leg of the cycle.
Key Economic Indicators Driving the Truckload Market
Is the U.S. economy going to tip into a recession, or will we have a soft landing?
There are several headwinds (continued inflation, slowing production), but there are a few mixed signals stubbornly hanging in there (strong employment, stable spending).
Regardless of what happens in the wider economy, the truckload market (though linked), is not always coupled.
We’ve had several economic recessions with inflationary truckload markets — we could still see an economic recession in later 2023 and an inflationary truckload market.
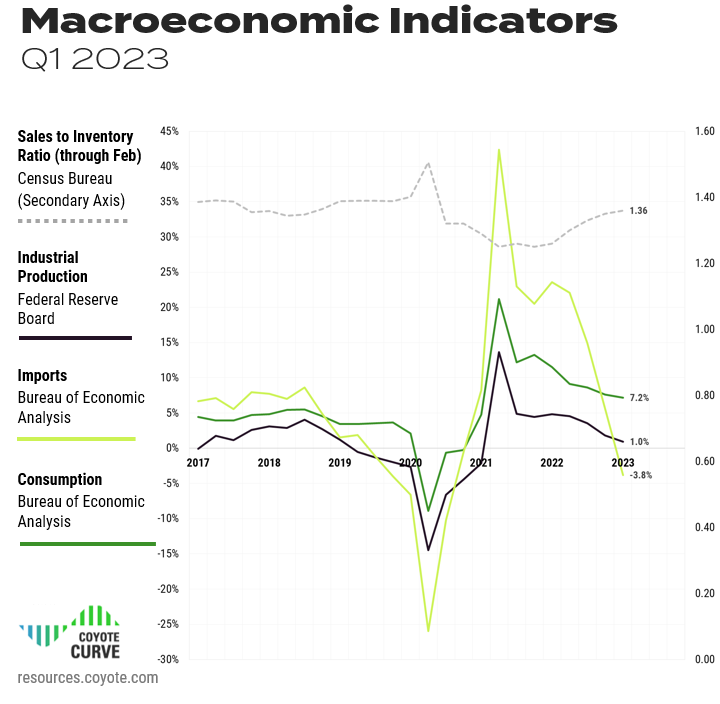
Let’s examine the most recent figures for industrial production, consumer spending, imports and inventories through the lens of how they are impacting truckload shipping.
Download these charts as high resolution slides for your next presentation.
Consumer Spending
After a several quarters of growth in 2022, personal consumption expenditures showed signs of slowing in Q4, dipping down from 8.4% Y/Y at the end of Q3 to 7.6% in Q4, driven by persistent inflation and fears over a possible 2023 recession.
If consumers continue to spend less (particularly on goods), it will drag down IP and imports, which will mean less freight shipping in the U.S.
Through Q1, consumer spending dipped again, but only slightly, down to 7.2%. However, in each month of Q1, spending has dropped from 8.13% (Jan.) to 7.35% (Feb.) to 6.16% (Mar.), so unfortunately it’s trending in the wrong direction.
If it continues to drop, it could push back any meaningful rise in demand in the second half of the year.
Industrial Production (IP)
IP has been trending downwards for several quarters, and finished Q3 2022 at 3.5%, Q4 at 1.8% Y/Y, and Q1 at 0.95%, barely in positive territory.
This drop follows the similar decline in consumer spending.
Furthermore, many shippers have excess inventory they are trying to work off before replenishing their stocks, and the potential threat of a recession is likely making them even more hesitant.
If this index drops deflationary for several quarters, it will have a significant impact on available truckload freight.
Imports (of Goods)
With chaos in international shipping markets over the past two years, this indicator has been particularly volatile.
After hitting a high of 44.9% last year, imports (of goods, excluding services) were down to 5.7% Y/Y at the end of Q4.
Once again, imports of goods dropped down to -3.8% Y/Y at the end of Q1, keeping with overall volume decline. That said, the Q1 2022 comparison was really tough, as the post-COVID global trade economy was firing back up, so did imports.
Looking at sequential change from Q4 2022, imports actually ticked up slightly, and typically Q4 (with holiday spending) is seasonally higher.
Inventory-to-Sales (Through February 2023)
Over the past two years, to combat overall supply chain volatility and high demand, shippers built up their inventories. Now, businesses are trying to shed it amidst falling demand and rising interest costs.
Q4 finished at 1.35, and increase for the fourth straight quarter.
And it wasn’t trending in the right direction — looking at the month-to-month readings, it grew from October (1.33) to November (1.35) to December (1.37).
Yet in 2023 we’ve seen a promising reverse of course, registering 1.34 in both January and February. If companies are able to de-stock, we could see that pay off with increased imports and production in the second half of the year.
Macroeconomic Takeaway
The economic indicators that most directly affect truckload shipping are mixed, but whether or not we tip into a recession, the truckload cycle will continue its course.The last time the cycle went inflationary (2020 – 2021), incremental freight demand drove rate growth. For the upcoming inflationary leg, the macroeconomic outlook doesn’t support a huge spike in demand.
Instead, supply-side constraints (carrier attrition) will be the driving force.
Truckload Market Trends to Watch in Q2
We are seeing many tell-tale signs that we have likely reached the bottom of the truckload market cycle.
What remains to be seen is how long will it take to rebound back into an inflationary environment.
Let’s unpack a few of the key trends impacting the market before we dive into the updated Q2 forecast.
1. Freight Volumes
As we covered in the macroeconomic analysis, we’re seeing a consistent slowing of truckload shipment volume.
Early Q1 is seasonally the slowest time of year, and this year saw year-over-year decline. If lagging freight volumes persist throughout Q2, it will further pressure rates and carriers.
This would bring about a faster bounce back, as more capacity would exit the market faster.
2. Diesel Fuel
After historically high diesel rates, carriers have started to get consistent relief in Q1.
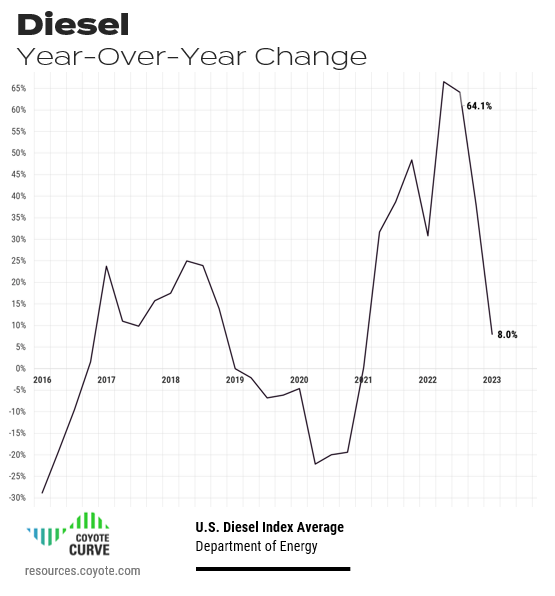
Though still well above pre-pandemic levels, in Q1, diesel trended downwards to 8.0% Y/Y, with a low of $4.13 a gallon in March — the lowest rate per gallon since February 2022 (the month Russian invaded Ukraine).
Download these charts as high resolution slides for your next presentation.
Diesel fuel, which represents around 30% of a carrier’s overall cost, can have a huge impact on a trucking company’s profitability if it rises or falls faster than freight rates.
Though on its surface it may seem like a welcome trend, the drop in fuel has also contributed to the drop of the floor for spot rates. With falling diesel, carriers have been able to absorb a little lower rates, prolonging the deflationary leg of the cycle.
If, conversely, fuel reverses course and gets more expensive, the opposite will be true (faster back to Y/Y inflation).
3. Class 8 Truck Orders
Though the worst of COVID-era supply chain shortages are in the rear view, we’re still dealing with the aftermath.
There is a lot of pent-up demand from carriers.
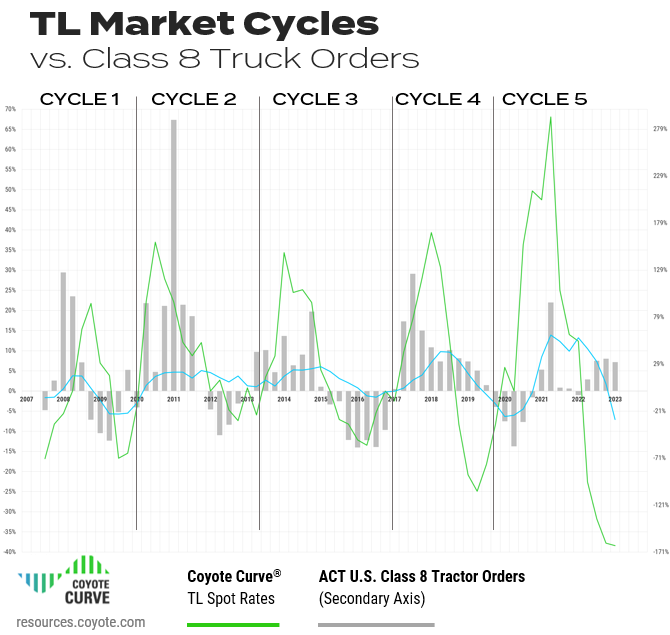
Q1 2023 orders were up 31% on a Y/Y basis, which is atypical for this point in the cycle. Spot rates have been dropping for over a year, which historically leads to a decline in orders.
But orders are still slowing down.
Sequentially (Q1 vs. Q4 2022), truckload orders fell.
Furthermore, the Y/Y comparison was easy to beat. In Q1 of 2022, there were lingering omicron effects and the supply chain shortages. Original equipment manufacturers (OEMs) didn’t open up the order books because they couldn’t fulfill them.
What we’re seeing now is not likely incremental demand, but existing demand that can finally be met. Well-capitalized fleets are snatching up build slots to turn over aging tractors.
4. Contract vs. Spot Rates
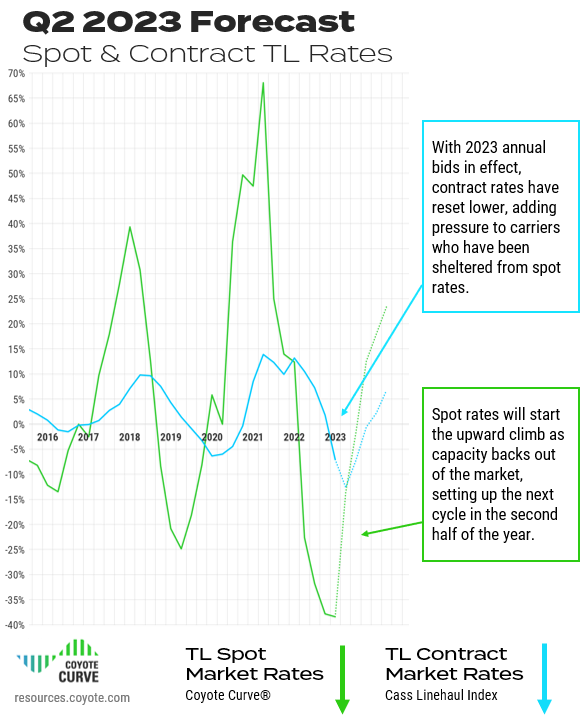
The results from 2023 bid season are mostly in, and as expected shippers used this transportation RFP as an opportunity to bring their contract rates back towards pre-pandemic levels.
Carriers that had been running freight on primary rates were getting a significant premium to the spot market — through Q4 2022, the divergence of spot and contract were near an all-time high.
Now that most primary rates have reset from 2023 annual bids, carriers (especially larger ones more exposed to contract freight) are feeling the crunch, especially if they have new equipment on the books (i.e., fixed costs).
Competition is fierce, margins are razor-thin and many carriers are potentially running spot freight at a loss.
Again, this will contribute to the next inflationary leg of the cycle. When these two lines cross (as our spot index travels up), we’ll start to see the shift from a shipper’s market back to a carrier’s market.
5. Carrier Employment
While the supply side of the industry is certainly feeling the pressure, there is a stat that has remained stubbornly strong: employment.
After a decrease throughout 2020, employment in the trucking sector grew steadily for all of 2021 and 2022.
2023 started to show a cooling labor market…until March, which posted a sharp reversal, adding roughly 12,000 jobs on a seasonally adjusted basis.
After significant declines in February, this was unexpected; however, looking at a Y/Y basis, growth has dropped to the slowest pace since the pandemic began.
Truckload Trends Takeaway
Slowing freight volumes, declining spot rates, an influx of new trucks, and rapidly dropping contract rates will keep the pressure on the supply side heading into Q2.This will start driving capacity out of the market, bringing about the inflationary climb.
Even with strong employment, two record years (2021 & 2022), and declining diesel, many carriers are operating spot freight at break even levels (or worse).
Q2 2023 Truckload Market Forecast
We’ve covered the macroeconomic environment, and key trends — but where does it leave us going forward?
Let’s look at the forecast.
Download these charts as high resolution slides for your next presentation.
Though we thought we would hit a deflationary inflection point in Q4, there was a little digging to go.
But we think Q1 was the turn of the tide, as rates just can’t go much lower given all the constraints to the supply side.
We think we’ll see real upward movement in Q2 (especially given favorably Y/Y comparisons), and an inflationary environment by Q4 (a couple quarters later than we previously anticipated).
Though our index will start going up, we don’t think it will represent a huge increase in actual costs. We expect a relatively stable capacity and rate environment, though it won’t be as muted as it is now.
The first real test will be for Road Check Week (AKA DOT Week) in mid-May. If carrier attrition has begun in earnest, we’ll expect to see a decent bump in cost, even if freight volume levels are down.
If DOT Week comes and goes without much fanfare, we’ll expect to continue moving sideways through the summer rather than significant cost inflation.
Forecast Takeaway
We’re well into a deflationary spot market, but the rate of decline has slowed.We think Q1 marked the trough, and significant cost pressures on carriers will set off the next inflationary rate environment, which we expect to hit in the second half of 2023 (regardless of whether or not we dip into an economic recession).
When Does the Rest of the Industry Think the Market Will Flip?
Almost every supply chain professional understands the basic cyclicality of the truckload market — it’s the when, not the if that’s up for debate.
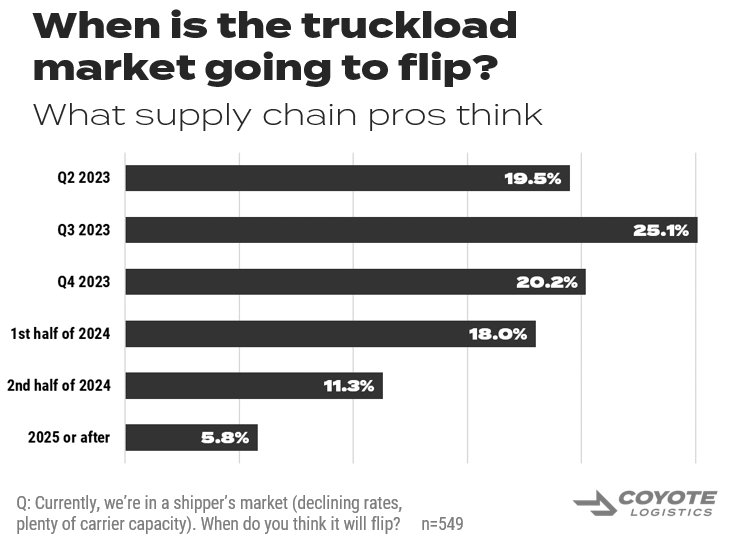
To get feedback from the wider industry, we ran a poll in March and April to gauge sentiment, asking people when they thought we’d transition from the current shipper’s market to a carrier’s market.
Over 500 supply chain professionals weighed in, including shippers, carriers, 3PLs, analysts and researchers.
Looking at the results, the winner was Q3 2023, with 25.1% of respondents. A further 19.5% believed this quarter would be the turning point.
However, a majority (55.3%) believe we won’t see the shift until Q4 or later (as a reminder, we predict we’ll see Y/Y inflation in Q4).
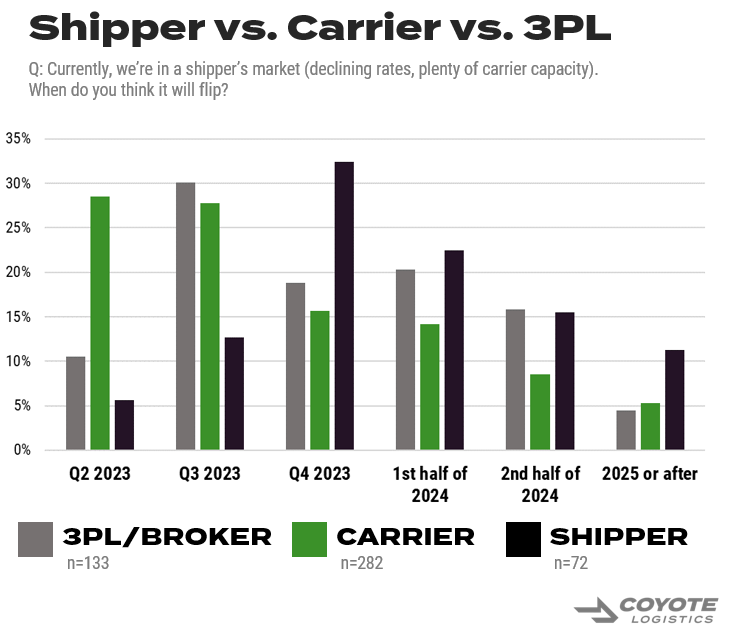
Interestingly, the results varied by respondent type, and there is misalignment of perception.
56% of carriers believe the turn will happen in Q2 or Q3. This could be wishful thinking for better rates, or a due to a more intimate knowledge of how unsustainably low spot rates currently are.
Only 19% shippers, however, think it will happen that fast. Fresh off a bid season which saw contract rate deflation, it’s understandable to feel a bit more secure in their position.
3PLs fell somewhere between, with 41% believing it will happen before Q4.
What Can You Do?
There is no silver bullet or special trick — it comes down to fundamentals.
Use the (relative) lull in shipping environment to maximize planning and communication with your core freight providers.
As implement your bid rates, be prudent about where you’re cutting rates and trimming capacity.
We still believe that the end of 2023 will look different than the beginning, and some rates that seem too-good-to-be-true now may end up being re-priced in Q4.
Want to Know How Your Peers Are Working With Providers?
You can get insights from 500 shippers with our latest, independent research study on supply chain outsourcing.
Read The Outsourcing Study Now
Continued Learning: Truckload Market 101
These three helpful resources will help you learn about truckload market fundamentals and how we build our proprietary index.
If you’re new to the Coyote Curve, take a few minutes to familiarize yourself with this foundational content:
Part I: Supply & Demand 101: Basics of Truckload Market Economics
Part II: Understanding the U.S. Truckload Market
Part III: Explaining the Coyote Curve
*We use the Cass Truckload Linehaul index as a proxy for contract rate performance.


