Q4 2024 Truckload Market Forecast: Spot & Contract Freight Rate Trends

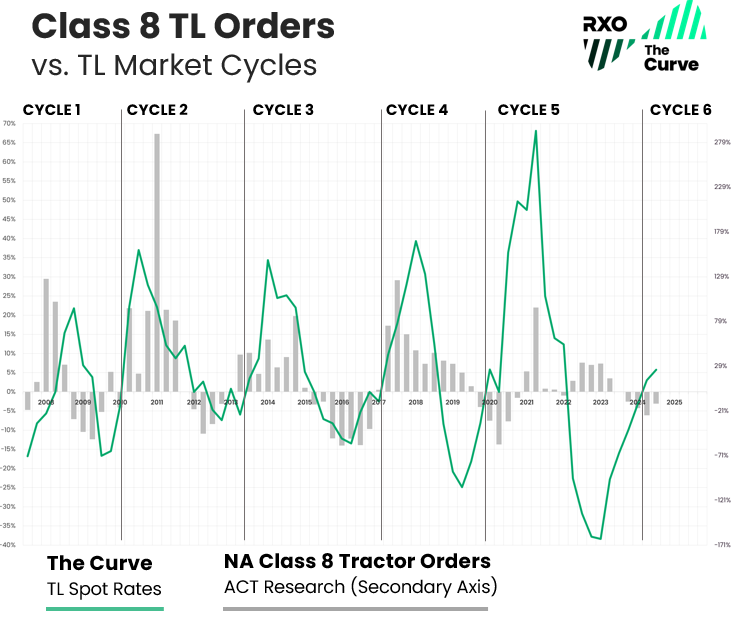
En nuestro última actualización trimestral, the Curve index finally crossed the threshold, and we entered into an inflationary market — this ended the fifth market cycle (in our observed history) and kicked off the sixth.
While we may be back in an inflationary environment, it doesn’t exactly feel like it (at least not yet) for most logistics professionals.
What does that mean for shippers and carriers? Will 2025 actually bring back volatility to the market, or will it be a repeat of 2024?
We’ll tell you everything you need to know about the past quarter and what to expect throughout the rest of Q4 and beyond in the latest truckload market guide.
Mercado de carga de camiones del tercer trimestre:
La guía completa para profesionales de la logística
- Q3 trucking spot & contract rate recap
- Perspectivas económicas: indicadores que impulsan la demanda de transporte de mercancías
- Tendencias del transporte por carretera que impactan el mercado
- Previsión del mercado de carga de camiones para el cuarto trimestre
New to the Curve?
Estos recursos esenciales del mercado de carga de camiones le brindará conocimientos básicos de la industria y le enseñará cómo construimos nuestro índice de tasas al contado patentado.
RXO & the Curve
RXO acquired Coyote Logistics in September 2024. As a new, combined company, we will not only continue publishing industry-leading insights (like the Curve) — we plan on making them even better. Now, as the now third largest 3PL in North America, we’ll have an even broader, richer dataset to analyze. We look forward to bringing you improved content in 2025.
Q3 2024 Spot & Contract Trucking Rate Recap
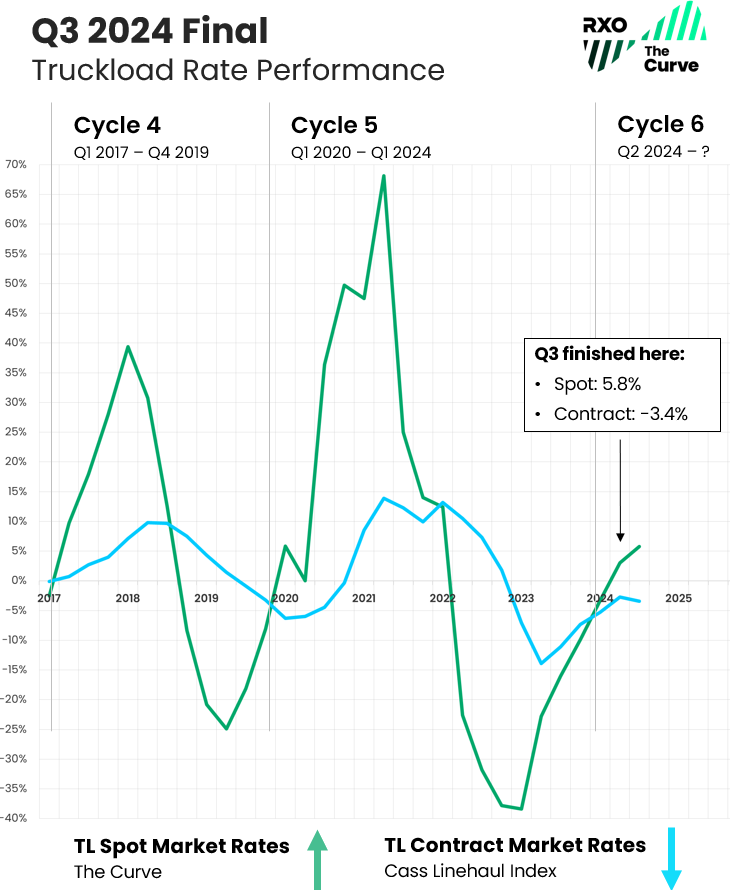
In Q3, the Curve continued its upward climb into Y/Y inflation, in-line with our prediction.
Descargue todos los gráficos de pronóstico como diapositivas para su próxima presentación usando el formulario a su derecha.
Q3 truckload spot rates continued their inflationary rise.
Truckload spot rates finished Q3 at 5.8% Y/Y, up from 3.0% in Q2.
Q3 truckload contract rates trended down.
Tarifas de contrato de carga de camión* trended downwards to -3.4%, a dip from -2.7% Y/Y in Q2 2024.
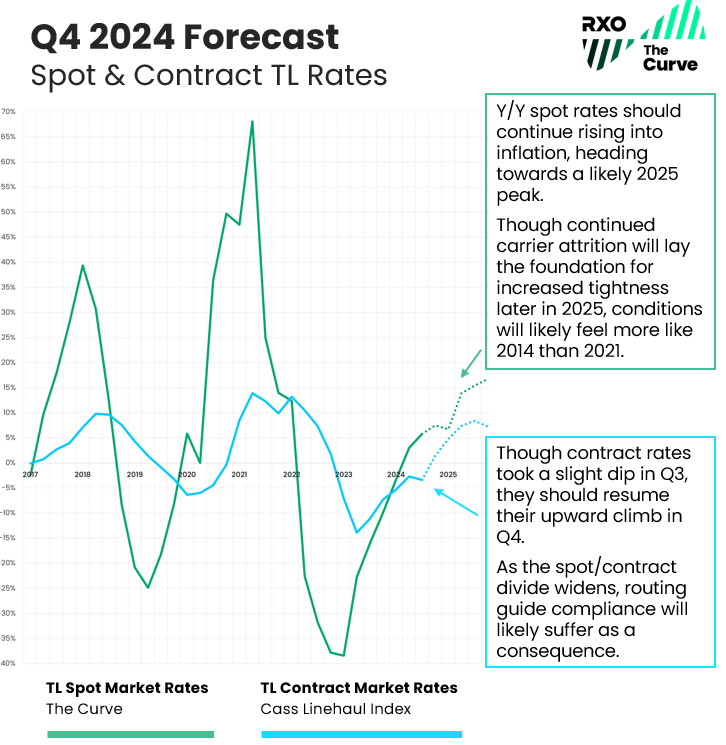
Looking at previous cycles, trend lines are rarely linear, and kinks are common. Furthermore, tarifas de contrato usually lag spot rate activity by two to three quarters, so this slight downturn is still in-line with past performance. We expect contract rates to continue their upwards climb in the following quarters.
Tarifas reales de carga de camiones al contado frente a Y/Y
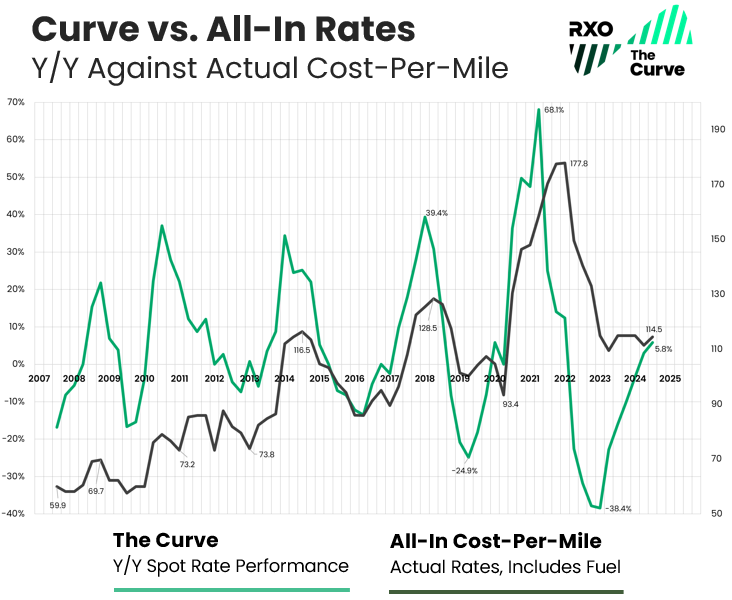
To build further confidence in the Curve (a Y/Y spot rate index), let’s see it up against our proprietary all-in cost-per-mile index — this is comparing annual change (without fuel) versus the actual rate (all-in cost, with fuel included).
(Como recordatorio, estas cifras se basan en datos transaccionales reales de miles de envíos diarios que abarcan más de 17 años).
Descargue todos los gráficos de pronóstico como diapositivas para su próxima presentación usando el formulario a su derecha.
If you feel like the market has been stagnant, you’re not wrong — our all-in index has remained essentially flat for most of the past two years.
Even recent major shipping events (Labor Day, a short-lived port strike, back-to-back hurricanes) failed to drive a major change.
In previous truckload market cycles, when shipping events hit during the upswing to inflation, they tend to accelerate market activity. Though we observed a slight rate bump and some regional volatility, we failed to see a sustained push upwards.
The cost-per-mile index may have found the bottom, but it’s still only hovering around levels from the 2014 peak.
Eso significa que, en términos absolutos, los transportistas obtienen actualmente tarifas spot similares a las de hace nueve años, aunque sus costos operativos (diésel, seguros, mano de obra, etc.) han aumentado sustancialmente. En pocas palabras, no hay margen para que las tarifas bajen, ya que muchos operadores han estado operando a niveles insostenibles.
With continued attrition in the carrier market, it’s likely we’ll continue to see this index head up as well in the coming quarters.
Q3 2024 Truckload Market Recap
The Curve (measuring Y/Y change in spot rates) continued its upward climb for the sixth straight quarter, though all-in rates (actual amount paid to carriers) remained relatively flat (and have since early 2023).
Though we headed higher into an inflationary rate environment, Q3 was still primarily a shippers’ market, and major events (hurricanes, holidays) had little impact to rates as a whole.
Carriers remained under significant cost pressure, while shippers enjoyed high tender acceptance, easy capacity and slight rate decreases in their RFPs.
Indicadores económicos clave que impulsan el mercado de carga de camiones
Through Q3 2024, the economy isn’t receding, but it isn’t roaring back either.
Este relativo estancamiento en los indicadores macroeconómicos significa volúmenes de carga de camiones reducidos, lo que ha frenado la recuperación del mercado de transporte de mercancías.
Vale la pena señalar que, si bien el mercado de camiones está vinculado a lo que sucede en la economía en general, no siempre está acoplado (ver la curva inflacionaria de 2008 durante la Gran Recesión).
dado como Trabajo de oferta y demanda en el mercado de carga de camiones., es posible que la economía se mantenga fuerte y que el mercado de camiones languidezca (y viceversa).
Examinemos las cifras disponibles más recientes sobre producción industrial, gasto de consumo, importaciones e inventarios a través de la lente de cómo están impactando el envío de camiones.
Descargue todos los gráficos de pronóstico como diapositivas para su próxima presentación usando el formulario a su derecha.
Gastos de consumo personal
- ¿Qué es?
How much the American consumer is spending. - Cómo afecta el envío de cargas por camión:
Cuanto más compramos, más necesitamos producir (IP) y/o comprar en otros lugares (importaciones), lo que se traduce en una mayor demanda de envío de camiones.
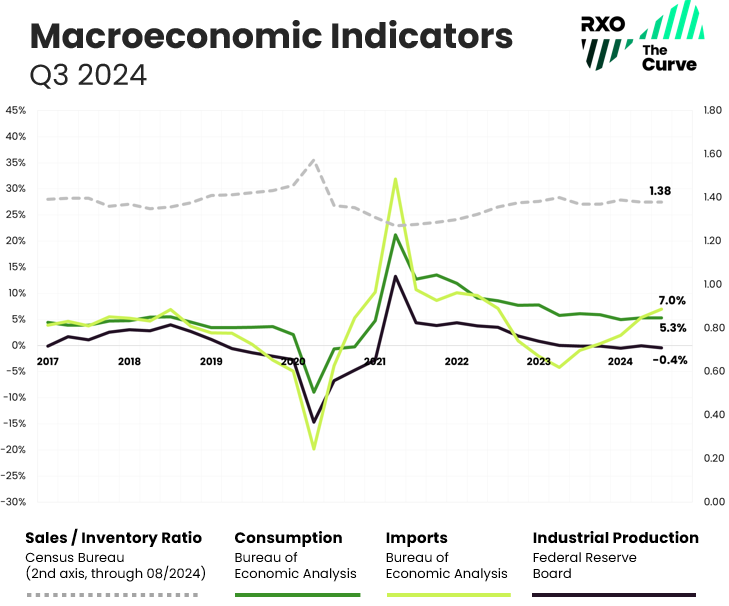
A pesar de la inflación persistente y los temores sobre una posible recesión, el gasto del consumidor se ha mantenido estable, helping to buoy the overall economy. Though the rate of growth has steadily slowed since Q4 2021, it is still growing — through Q3 2024, PCE is at 5.3% Y/Y, up slightly from 5.2% in Q1.
However, it’s worth noting the balance between physical goods consumption and services. When COVID struck, service-related industries closed and demand for physical goods soared to 15-year highs in an incredibly short period of time, driving a corresponding inflationary spot market.
Over the past several years post-COVID, consumers are spending more money on services (vacations, dining, entertainment, etc.), decreasing physical goods’ share. While overall spending on goods was up 2.8% Y/Y in Q3, spending on services increased even more (6.9% Y/Y), and the goods’ share of total spending continued to decline.
We’ll look for any increase in this to drive more freight demand in the coming months.
Producción Industrial (PI)
- ¿Qué es?
Total value of physical goods America is producing. - Cómo afecta el envío de cargas por camión:
The more we make, the more freight that needs to move, from raw material inputs to finished goods.
Though IP, like consumer spending, has trended downward for several quarters, it is still stable. Through Q3 2024, the index sits at -0.4% Y/Y, down slightly from Q2.
While we don’t anticipate a large uptick in production (that would increase overall truckload volumes), as long as it remains stable, demand is not very likely to decrease either.
Importaciones (solo bienes)
- ¿Qué es?
Total value of physical goods America is buying from other countries. - Cómo afecta el envío de cargas por camión:
The more we buy from other countries, the more freight that needs to move, from raw material inputs to finished goods.
Importaciones (of goods, excluding services) ended Q3 at 7.0% Y/Y. The slight uptick in imports are encouraging signs for increased freight later in the year.
It’s also possible that we’ll see a short-term spike in imports in the coming quarter, as international shippers try to pull in more inventory ahead of any potential tariff-related and/or potential port strike volatility.
Inventory-to-Sales (through August)
- ¿Qué es?
The ratio of physical goods businesses have in stock vs. how much they’re selling. - Cómo afecta el envío de cargas por camión:
Cuando los niveles de inventario son altos, se crea un retraso en la demanda de envío de camiones, ya que las empresas eliminarán el exceso de inventario antes de producir nuevos bienes (IP) o comprar más bienes (importaciones).
Después de que las interrupciones en la cadena de suministro relacionadas con la pandemia causaran estragos en los inventarios de los transportistas, muchos comenzaron a acumular existencias en un esfuerzo por combatir la volatilidad y satisfacer la demanda.
A lo largo de 2023, muchas empresas intentaron deshacerse de inventario en medio de una caída de la demanda y un aumento de los costos de intereses.
Después de alcanzar un máximo de 1,40 en diciembre de 2022, el índice ha tendido ligeramente a la baja, staying between 1.36 and 1.39 for every month since then — through August (most recent available), the index is sitting at 1.38.
With the index remaining stable for the past year, it’s likely the inventory destocking efforts were successful. There are also signs that some restocking has been underway over the past couple quarters leading up to Q4 shipping.
Conclusión macroeconómica
Nothing much has changed since Q2 — all the major indices are essentially flat, with a slight increase in imports being the exception.A pesar de los continuos vientos en contra durante el año pasado, la economía estadounidense parece haber evitado obstinadamente una recesión.
Aunque todavía estamos saliendo de una recesión del transporte de mercancías, el ciclo de carga de camiones seguirá su curso.
La última vez que el ciclo se volvió inflacionario (2020 – 2021), la demanda incremental de transporte impulsó el crecimiento de las tarifas. Para este tramo inflacionario, las perspectivas macroeconómicas aún no respaldan un aumento masivo de la demanda.
En cambio, las limitaciones del lado de la oferta (desgaste de operadores) probablemente serán la fuerza impulsora.
Tendencias del mercado de carga de camiones a tener en cuenta en el cuarto trimestre
We have climbed out of the trough of the truckload market cycle and heading higher into Y/Y inflation. Let’s unpack a few of the key trends impacting the market before we dive into the pronóstico actualizado del cuarto trimestre.
1. Spot and contract rates are still comparable (for now).
Durante los últimos dos años, los transportistas han utilizado sus RFP de transporte as opportunities to bring their contract rates (aka primary rates) back toward pre-pandemic levels.
And they were largely successful — we have seen the longest stretch of discounted spot rates compared to contract rates in history, lasting over two-and-a-half years.
Even though spot rates have already bounced off the bottom, many companies are still trying to get in one last round of reductions.
Those rates and routing guides set in the softer market of 2024 may not survive a tighter market in 2025, when the spot market will (likely) become more lucrative than the contract market.
We’ve already seen that in Y/Y terms, and have started to see it in absolute terms over the summer holiday shipping surges, though rates couldn’t sustain momentum.
As we get into the holidays and the two diverge further, it will create tension across guías de enrutamiento a medida que los transportistas buscan atraer más conductores al mercado spot. Veremos cómo comienza el cambio del mercado de transportistas al mercado de transportistas.
2. Private fleets are soaking up for-hire freight.
En un esfuerzo por combatir la volatilidad sin precedentes de 2020 y 2021, los transportistas tomaron medidas para crear o ampliar sus flotas privadas.
Esto añadió mucha resiliencia en forma de capacidad garantizada y tarifas predecibles, pero con la caída general en los volúmenes de carga, hubo mucha holgura en la línea.
Este exceso de capacidad de la flota privada ha absorbido una gran cantidad de carga que de otro modo habría llegado al mercado spot de alquiler.
Hasta que los volúmenes de envío aumenten significativamente, los transportistas reduzcan sus flotas privadas o (muy probablemente) el mercado de alquiler siga reduciéndose, esto actuará como un baluarte contra el crecimiento de las tarifas al contado y prolongará las condiciones más débiles del mercado.
3. Fuel prices are stable, throttling rate inflation.
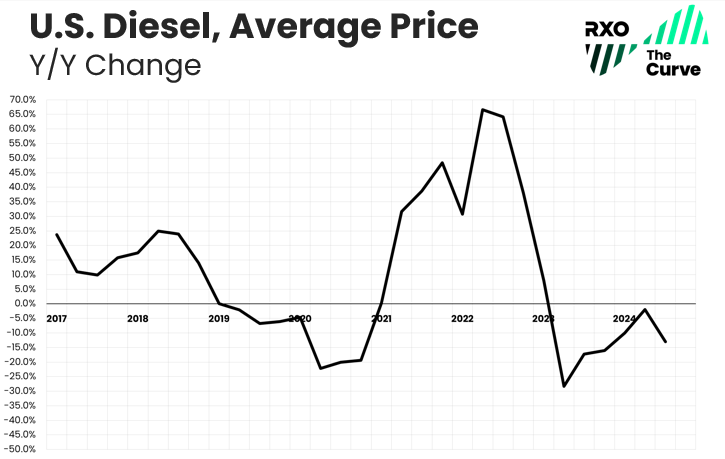
Diesel has been on a wild ride over the past several years.
De 2015 a 2022, el diésel, con algunas excepciones, promedió entre $2,50 y $3,50/galón.
In 2022, it ballooned up to $5.70, dropped to $3.80 in 2023, shot up to $4.60 late in 2023, then has been dropping down for most of 2024, hovering around $3.60.
¿Por que importa?
El combustible diésel, que representa alrededor de 30% del coste total de un transportista, puede tener un enorme impacto en la rentabilidad de una empresa de transporte si sube o baja más rápido que las tarifas de flete.
Muchas aerolíneas pudieron absorber costos de combustible históricamente altos en 2022 debido a tarifas históricamente altas. Ese ya no es el caso desde hace algún tiempo.
Si el combustible se encarece (por ejemplo, si se produce otro evento geopolítico en una nación productora de petróleo, como vimos con la invasión rusa de Ucrania en 2022), veremos un aumento más rápido de la inflación a medida que los transportistas ya no puedan absorber el aumento.
Since it has been stable, we’ve seen a lower rise to the upside.
4. Carriers are buying fewer trucks.
Después de permanecer positivo durante seis trimestres consecutivos (a pesar de que los tipos al contado cayeron durante más de un año), en el cuarto trimestre de 2023, los pedidos de camiones finalmente tocaron fondo.
Q3 2024 was another continuation of the trend, as Class 8 tractor orders (as rastreado por ACT Research) were down -13% on a Y/Y basis.
Este es otro indicador que muestra la tensión financiera sobre la base de suministro: los transportistas se han puesto al día con los retrasos de la era COVID y la necesidad de capacidad incremental, o la capacidad de entregar equipos viejos, está disminuyendo.
5. El empleo de transportistas sigue disminuyendo.
Durante la mayor parte de 2023 y 2024, las cifras de empleo de conductores se mantuvieron curiosamente sólidas, a pesar de las condiciones más débiles del mercado.
A medida que los volúmenes de carga cayeron, muchos conductores acudieron en masa a la seguridad de flotas más grandes que estaban más expuestas a lucrativos contratos de carga.
A medida que estos conductores pasaron de ser propietarios-operadores (que no aparecen en los datos de nómina) a empleados W2 en flotas, los datos de empleo de la Oficina de Estadísticas Laborales (BLS) aumentaron a pesar de que la cantidad real de capacidad en el mercado era o plano o hacia abajo.
Throughout most of 2024, we’ve started to see carrier attrition show up in employment numbers, and continue to see more attrition over the past few months. We expect that continue as the full Q3 figures roll in.
All Employees, Truck Transportation (from the BLS, through September)
- Decreased sequentially for six consecutive months.
- Decreased Y/Y every month this year except August (the 2023 Yellow bankruptcy causing the one exception).
Production & Non-Supervisory Employees, Long-Distance Trucking (aka Drivers, from the BLS, through August)
- Decreased sequentially for four of the past five months.
- Decreased Y/Y every month this year except August (the 2023 Yellow bankruptcy causing the one exception).
Autoridades Operativas (de la FMCSA)
- There was a net decrease of 1,739 operating authorities in September.
- The population has declined in 22 of the past 24 months, leading to a total decrease of ~47,000 operating authorities over that time frame (for context, there were around 100,000 adiciones from 2020 to 2022).
Conclusión sobre las tendencias de carga de camiones
Not much has changed since Q3: Though freight volumes are sluggish, there are signs of carrier attrition in employment and authority revocations.
The speed and severity of the upward climb will depend on how fast carrier capacity exits the market, but after weak Q3 freight volumes, decreasing contract rates setting in, it will likely speed up in Q4.
Q4 2024 Truckload Market Forecast
Hemos cubierto el Ambiente macroeconómico, y tendencias clave – pero ¿dónde nos deja en el futuro?
We predict the Curve will continue it’s move into inflation, driving toward a peak in 2025.
Aunque la capacidad y las tarifas pueden parecer estables, estamos en un entorno cambiante.
We continue to see carrier capacity leave the market (albeit somewhat slowly). Also, with bid rates continuing to come in lower and spot rates trending higher, the divergence will drive volatility as cash-strapped carriers look to increase profitability after a very difficult two years.
All that said, while we are in an inflationary market, we don’t anticipate the sort of extreme conditions we experienced in the last inflationary market in 2020 and 2021.
Based on recent history and current market dynamics (shrinking but still available capacity, stable demand), it’s quite possible we’ll see a lower potential market peak.
For guidance, a look back to 2014 would likely be a better comparison.
We may still get a more traditional peak if we experience any combination of an increase in demand, a faster-than-expected exit of carriers, a robust peak season coupled with winter storms, or a spike in diesel, but we think a conservative outlook more likely.
Conclusión del pronóstico
Estamos en un mercado al contado inflacionario y nos dirigimos a un pico del mercado en 2025.With contract rates remaining Y/Y deflationary, spot rates will overtake contract. This dynamic will create pressure for shippers in the coming months.
While Q4 might not feel like a dramatically different operating environment, we are in a changing marketplace that is setting us up for a more meaningful flip next year.
¿Qué puedes hacer?
No sea demasiado agresivo en la reducción de tipos.
Though tempting, be prudent about where you cut rates and trim capacity — we believe 2025 will look different than 2024.
Las ganancias a corto plazo de hoy podrían costarle en el mercado al contado mañana.
Mantenga a los principales proveedores de transporte en el juego.
Incluso si tiene un volumen limitado y los necesita ahora, si cree que los necesitará en un mercado ajustado, manténgalos interesados en su guía de enrutamiento.
Ahora es el momento de maximizar la planificación y la comunicación con los proveedores que más le interesan.
Pon tus KPI en orden.
Es fácil aflojar cuando las tarifas son bajas y el servicio alto. Prepárese para un mercado más difícil estableciendo y comunicando sus KPI a sus operadores. Asegúrese de contar con un buen sistema de puntuación para los operadores.
Si necesita repasar los puntos de referencia del transporte, consulte nuestro estudio de investigación sobre KPI de logística.
Aprendizaje continuo: Mercado de carga de camiones 101
Estos tres recursos útiles lo ayudarán a conocer los fundamentos del mercado de carga de camiones y cómo construimos nuestro índice patentado.
If you’re new to the Curve, take a few minutes to familiarize yourself with this foundational content:
Parte I: Oferta y demanda 101: conceptos básicos de la economía del mercado de carga de camiones
Parte II: Comprender el mercado de carga de camiones de EE. UU.
Parte III: Explaining the Curve
*Usamos el Índice Cass Truckload Linehaul como indicador del desempeño de la tarifa del contrato.
¿Quiere los gráficos de pronóstico para su próxima presentación?
Complete este breve formulario para descargar todos los gráficos de la guía del mercado de carga de camiones de este trimestre en forma de diapositivas.


